Value stream mapping is a powerful tool in production and operations management. It visualizes the flow of materials and information, helping identify inefficiencies and bottlenecks in production processes. By highlighting value-adding and non-value-adding activities, it enables waste reduction and process optimization.
This technique supports lean manufacturing principles and continuous improvement initiatives. It provides a holistic view of production, improving communication across departments and aiding decision-making for resource allocation. Value stream mapping is crucial for implementing just-in-time systems and enhancing overall operational efficiency.
Definition of value stream mapping
- Value stream mapping visualizes end-to-end flow of materials and information in a production process
- Identifies all steps, both value-adding and non-value-adding, required to bring a product from raw materials to the customer
- Serves as a foundational tool in lean manufacturing and continuous improvement initiatives
Purpose and benefits
- Provides a holistic view of the entire production process, enabling identification of inefficiencies and bottlenecks
- Facilitates waste reduction by highlighting non-value-adding activities
- Improves communication and collaboration across different departments involved in the production process
- Aids in decision-making for process improvements and resource allocation
- Supports the implementation of lean principles and Just-In-Time (JIT) production systems
Key components
Value-adding activities
- Operations that directly contribute to creating or enhancing the product or service
- Transform raw materials or components into finished goods
- Include activities customers are willing to pay for (assembly, painting, packaging)
- Measured by the time spent on these activities compared to total production time
Non-value-adding activities
- Steps in the process that do not directly contribute to the product's value
- Categorized into necessary non-value-adding (inspections, regulatory compliance) and pure waste
- Examples include excessive inventory, overproduction, and unnecessary transportation
- Focus of improvement efforts to streamline the production process
Information flow
- Represents how data and instructions move through the production system
- Includes customer orders, production schedules, and supplier communications
- Visualized using different symbols to show manual or electronic information transfer
- Critical for understanding decision-making processes and potential delays in the system
Steps in value stream mapping
Current state map
- Depicts the existing production process as it currently operates
- Created through direct observation and data collection on the shop floor
- Includes all process steps, inventory levels, and information flows
- Serves as a baseline for identifying improvement opportunities
Future state map
- Represents the ideal or improved version of the production process
- Developed based on analysis of the current state map and application of lean principles
- Focuses on eliminating waste and optimizing flow
- Sets targets for process improvements and guides implementation efforts
Implementation plan
- Outlines specific actions required to transition from the current state to the future state
- Prioritizes improvement initiatives based on impact and feasibility
- Assigns responsibilities and timelines for each action item
- Includes metrics to track progress and measure success of implementation
Symbols and icons
Process symbols
- Represent different types of operations in the production process
- Include dedicated process symbol (rectangle), shared process (overlapping rectangles), and manual process (person icon)
- Used to show where value is added to the product or service
- Often include cycle time, changeover time, and number of operators for each process
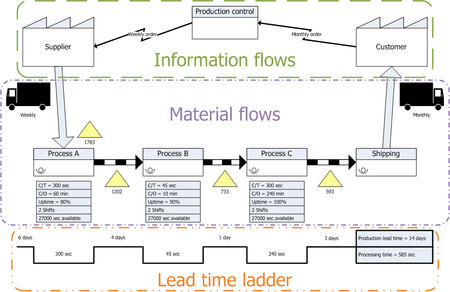
Inventory symbols
- Depict storage points and accumulation of materials in the process
- Triangle symbol represents inventory with quantity or time indicated
- Supermarket symbol shows controlled inventory points in pull systems
- Safety stock symbol indicates buffer inventory to protect against variability
Information flow symbols
- Visualize how information moves through the production system
- Include manual information flow (thin arrow), electronic information flow (lightning bolt arrow)
- Schedule or production control symbol (box) shows centralized planning points
- Kanban symbols represent different types of production signals (withdrawal, production, signal)
Value stream map analysis
Identifying waste
- Examines the map to locate the eight types of waste (DOWNTIME)
- Defects, Overproduction, Waiting, Non-utilized talent, Transportation, Inventory, Motion, Excess processing
- Quantifies waste in terms of time, resources, or costs
- Prioritizes waste reduction efforts based on impact and ease of implementation
Cycle time vs takt time
- Cycle time measures how long it takes to complete one unit of production
- Takt time represents the rate at which customers demand products
- Calculated as
- Comparison helps identify imbalances and opportunities for process synchronization
Lead time reduction
- Focuses on minimizing the total time from order placement to delivery
- Identifies and eliminates non-value-adding activities that extend lead time
- Implements strategies such as reducing batch sizes and improving changeover times
- Aims to improve responsiveness to customer demand and reduce working capital requirements
Lean principles in VSM
Pull vs push systems
- Pull systems produce based on actual customer demand, reducing overproduction and inventory
- Push systems produce based on forecasts, potentially leading to excess inventory
- VSM helps identify opportunities to implement pull systems (Kanban, supermarkets)
- Transition from push to pull often involves creating a pacemaker process and establishing flow
Continuous flow
- Aims to move products through the production process with minimal interruptions or waiting
- Identified on VSM by closely linked process boxes without inventory triangles between them
- Implemented through layout changes, cellular manufacturing, or one-piece flow
- Reduces lead time, improves quality, and increases productivity
Kaizen events
- Focused improvement activities targeting specific areas identified in the VSM
- Usually short-term (3-5 days) intensive efforts involving cross-functional teams
- Addresses issues such as setup time reduction, quality improvement, or layout optimization
- Results are incorporated into updated VSMs to show progress and identify new opportunities
VSM tools and software
- Microsoft Visio offers templates and shapes specifically designed for creating VSMs
- Lucidchart provides a web-based platform for collaborative VSM creation and sharing
- eVSM software integrates with Excel for data-driven VSM analysis and simulation
- iGrafx Process for Six Sigma combines VSM capabilities with advanced process analysis tools
- Many ERP systems now include VSM modules for real-time process mapping and analysis

Limitations and challenges
- Difficulty in capturing complex processes with multiple product families or variations
- Static nature of traditional VSMs may not reflect dynamic changes in the production environment
- Requires significant time and resources to create accurate and comprehensive maps
- May overlook subtle inefficiencies or cultural factors affecting process performance
- Potential resistance from employees who fear job losses resulting from process improvements
- Challenges in maintaining and updating VSMs as processes evolve over time
Industry applications
Manufacturing
- Widely used in automotive industry to optimize assembly lines and supply chains
- Applied in electronics manufacturing to reduce lead times and improve product quality
- Utilized in food and beverage production to minimize waste and ensure food safety
- Implemented in aerospace manufacturing to manage complex, long-cycle production processes
Healthcare
- Employed to streamline patient flow in hospitals and reduce waiting times
- Applied to optimize laboratory processes and improve diagnostic test turnaround times
- Used in pharmacy operations to enhance medication dispensing efficiency and accuracy
- Implemented in surgical departments to improve operating room utilization and patient outcomes
Service sector
- Adapted for use in financial services to streamline loan approval processes
- Applied in software development to visualize and optimize the development lifecycle
- Utilized in call centers to improve customer service response times and quality
- Implemented in logistics and transportation to optimize route planning and delivery processes
Integration with other methodologies
Six Sigma
- Combines VSM with data-driven problem-solving approaches of Six Sigma
- Uses VSM to identify areas for improvement and Six Sigma tools to analyze and optimize processes
- Integrates statistical process control and capability analysis into VSM implementation
- Results in more robust and sustainable process improvements
Total Quality Management
- Incorporates VSM as a tool within the broader TQM framework
- Aligns VSM objectives with overall quality management goals and customer satisfaction
- Emphasizes employee involvement and continuous improvement in VSM implementation
- Integrates VSM with other TQM tools such as Quality Function Deployment and Failure Mode and Effects Analysis
Measuring VSM effectiveness
Key performance indicators
- Lead time reduction measured as percentage decrease in total production time
- Inventory turnover rate to assess improvements in inventory management
- On-time delivery performance to evaluate impact on customer satisfaction
- Productivity metrics such as units produced per labor hour or per machine hour
- Quality indicators including defect rates and first-pass yield improvements
ROI of VSM implementation
- Calculates financial benefits of improvements identified through VSM
- Considers cost savings from waste reduction and increased efficiency
- Factors in implementation costs including training, software, and process changes
- Evaluates long-term impact on profitability and competitiveness
- Typically measured over 1-3 year period to capture full benefits of process improvements