AP exam review verified for 2027

AP Physics 2 Unit 15 Review: Modern Physics

Review AP Physics 2 Unit 15 to understand how quantum theory replaced classical physics at atomic and subatomic scales. This unit covers wave-particle duality, atomic spectra, blackbody radiation, the photoelectric effect, Compton scattering, and nuclear processes including fission, fusion, and radioactive decay.

Use the topic guides, practice questions, FRQ practice, and AP score calculator available for this unit to build and check your understanding before exam day.

What is AP Physics 2 unit 15?

Classical physics could not explain why heated objects glow the way they do, why atomic spectra show discrete lines instead of a continuous rainbow, or why shining dim high-frequency light ejects electrons while bright low-frequency light does not. Quantum theory was developed to answer exactly these questions.

Unit 15 covers the quantum and nuclear physics that make up 12-15% of the AP Physics 2 exam. You will use E = hf, K_max = hf - phi, the Bohr energy formula, Wien's law, the Stefan-Boltzmann law, the Compton shift equation, E = mc², and N = N0 e^(-lambda t) to explain and calculate phenomena that classical mechanics cannot handle.

Quantum theory and atomic structure

Topics 15.1-15.3 establish the core quantum ideas: photons carry energy E = hf, matter has a de Broglie wavelength lambda = h/p, and electrons in atoms occupy only discrete energy levels. The Bohr model quantizes hydrogen's orbits, and transitions between levels produce the specific photon frequencies seen in emission and absorption spectra.

Blackbody radiation, photoelectric effect, and Compton scattering

Topics 15.4-15.6 are the three phenomena that proved light must be quantized. Blackbody spectra follow Wien's law and the Stefan-Boltzmann law. The photoelectric effect shows that electron emission depends on frequency, not intensity, described by K_max = hf - phi. Compton scattering shows photons carry momentum p = h/lambda and lose energy in collisions with electrons.

Nuclear processes and radioactive decay

Topics 15.7-15.8 cover the strong force, mass-energy equivalence, fission, fusion, and radioactive decay. Every nuclear reaction conserves nucleon number, charge, and momentum. Decay rates follow N = N0 e^(-lambda t), and the four decay types (alpha, beta-minus, beta-plus, gamma) each change the nucleus in predictable ways governed by conservation laws.

Why quantum theory changed everything

The central shift in Unit 15 is recognizing that energy and momentum are not continuous at atomic scales. Photons and electrons both exhibit wave and particle behavior depending on how they are observed. This quantization explains atomic spectra, the photoelectric effect, Compton scattering, and blackbody radiation in ways classical physics simply cannot. Nuclear physics extends this logic: mass itself is a form of energy, and unstable nuclei decay by strict conservation rules that determine which particles are emitted and how much energy is released.

AP Physics 2 unit 15 topics

15.1

Quantum Theory and Wave-Particle Duality

Introduces photons (E = hf), the de Broglie wavelength (lambda = h/p), and the evidence from double-slit experiments and electron diffraction that both light and matter exhibit wave and particle behavior.

open guide
15.2

The Bohr Model of Atomic Structure

Covers atomic structure (protons, neutrons, electrons), nuclear notation, isotopes, and the Bohr model's quantized circular orbits for hydrogen, including the energy formula E_n = -13.6 eV / n^2.

open guide
15.3

Emission and Absorption Spectra

Explains how photon emission and absorption correspond to electron transitions between discrete energy levels, producing unique line spectra for each element, read from energy level diagrams.

open guide
15.4

Blackbody Radiation

Describes how objects emit a continuous thermal spectrum governed by Wien's displacement law (lambda_max = b/T) and the Stefan-Boltzmann law (P = A sigma T^4), and why Planck's quantization was needed to explain the observed spectrum.

open guide
15.5

The Photoelectric Effect

Covers electron ejection by light, the threshold frequency, the work function, and the equation K_max = hf - phi, demonstrating that photon energy (not intensity) determines the kinetic energy of ejected electrons.

open guide
15.6

Compton Scattering

Treats photon-electron collisions using conservation of energy and momentum. The Compton shift Delta lambda = (h/m_e c)(1 - cos theta) shows photons carry momentum and lose energy when scattered.

open guide
15.7

Fission, Fusion, and Nuclear Decay

Covers the strong force, mass-energy equivalence (E = mc^2), conservation of nucleon number, fission and fusion energy release, and exponential radioactive decay kinetics (N = N_0 e^(-lambda t)).

open guide
15.8

Types of Radioactive Decay

Describes alpha, beta-minus, beta-plus, and gamma decay, including the particles emitted, changes in A and Z, and conservation of nucleon number, charge, and lepton number in each process.

open guide
practice snapshot

Hardest AP Physics 2 unit 15 topics

This snapshot uses Fiveable practice activity to show where students tend to miss questions and which review moves are worth prioritizing first.

62%average MCQ accuracy

Across 1.1k multiple-choice practice attempts for this unit.

1.1kMCQ attempts

Practice activity included in this snapshot.

58%average FRQ score

Across 4 scored free-response attempts for this unit.

Hardest topics in unit 15

MCQ miss rate
15.6

Review Compton Scattering with attention to how the concept appears in AP-style source and evidence questions.

47%135 tries
15.7

Review Fission, Fusion, and Nuclear Decay with attention to how the concept appears in AP-style source and evidence questions.

46%120 tries
15.5

Review The Photoelectric Effect with attention to how the concept appears in AP-style source and evidence questions.

44%104 tries
15.2

Review The Bohr Model of Atomic Structure with attention to how the concept appears in AP-style source and evidence questions.

39%127 tries

Unit 15 review notes

15.1

Wave-particle duality and photon basics

Quantum theory was developed because classical physics failed to explain atomic spectra, blackbody radiation, and the photoelectric effect. Light behaves as both a wave (interference, diffraction) and a particle (photons). Electrons and other matter particles also exhibit wave behavior, confirmed by electron diffraction experiments like Davisson-Germer. The de Broglie wavelength lambda = h/p applies to any particle with momentum p.

  • Photon energy: E = hf, where h = 6.626 x 10^-34 J·s and f is frequency. Photons are massless and electrically neutral.
  • Speed of photons: All photons travel at c = 3.00 x 10^8 m/s in free space. In a medium with index of refraction n, speed = c/n.
  • de Broglie wavelength: lambda = h/p. Any particle with momentum p has an associated wavelength, giving it wave-like properties.
  • Wave-particle duality evidence: Single photons and electrons both produce interference patterns in double-slit experiments, confirming wave behavior even for individual particles.
  • Quantization in bound systems: Particles confined to a region (like electrons in atoms) can only have discrete energy and momentum values, not a continuous range.
If a photon has frequency 6.0 x 10^14 Hz, its energy is E = hf = (6.626 x 10^-34)(6.0 x 10^14) = 3.98 x 10^-19 J. An electron with momentum 9.1 x 10^-25 kg·m/s has de Broglie wavelength lambda = h/p = 7.3 x 10^-10 m.
PropertyWave model of lightPhoton (particle) model of light
Explains interference and diffractionYesNo (single photon)
Explains photoelectric effect thresholdNoYes
Carries momentumIndirectly (radiation pressure)Yes, p = h/lambda
Energy depends onAmplitude (intensity)Frequency only
15.2

Bohr model and atomic structure

The Bohr model pictures electrons in circular orbits around a small, positively charged nucleus made of protons and neutrons. Only orbits where the circumference fits a whole number of de Broglie wavelengths are allowed (2 pi r = n lambda), which quantizes angular momentum and energy. For hydrogen, the energy of level n is E_n = -13.6 eV / n^2. The model correctly predicts hydrogen's spectral lines but does not generalize to multi-electron atoms.

  • Nuclear notation: An element is written as A over Z X, where Z is the proton number (atomic number) and A is the mass number (protons + neutrons).
  • Isotopes and ions: Isotopes have the same Z but different neutron counts. Ions have a nonzero net charge due to electron gain or loss.
  • Hydrogen energy levels: E_n = -13.6 eV / n^2. Ground state is n = 1 (E = -13.6 eV). Ionization requires 13.6 eV from the ground state.
  • Coulomb force in orbits: The electrostatic attraction between the electron and nucleus provides the centripetal force: k e^2 / r^2 = m v^2 / r.
  • Standing wave condition: 2 pi r = n lambda = n h/p. This forces only discrete radii and energies to be allowed.
For hydrogen in the n = 3 state, E_3 = -13.6 / 9 = -1.51 eV. The atom is in an excited state and can emit photons by dropping to n = 2 or n = 1.
Quantityn = 1 (ground)n = 2n = 3
Energy (eV)-13.6-3.4-1.51
Orbit radiusSmallest (a0)4a09a0
Ionization energy needed (eV)13.63.41.51
15.3

Emission and absorption spectra

An atom emits a photon when an electron drops from a higher to a lower energy level; it absorbs a photon when an electron jumps up. The photon's energy must exactly match the energy difference between the two levels: E_photon = hf = delta E. Because energy levels are discrete, each element produces a unique set of spectral lines that can be used to identify it. Emission spectra show bright lines on a dark background; absorption spectra show dark lines on a continuous background.

  • Photon emission: Electron drops from n_i to n_f (n_f < n_i). Photon energy = E_i - E_f = hf.
  • Photon absorption: Electron jumps from n_f to n_i (n_i > n_f). Photon must have exactly the right frequency; other frequencies pass through.
  • Energy level diagram: Horizontal lines represent allowed energies. Downward arrows are emission; upward arrows are absorption. The ionization threshold is E = 0.
  • Spectral line uniqueness: Each element has a unique set of allowed transitions, producing a fingerprint spectrum used in spectroscopy.
  • Connecting energy to wavelength: E = hf = hc/lambda. A larger energy gap produces a shorter wavelength (higher frequency) photon.
A hydrogen electron drops from n = 3 to n = 2. Delta E = -1.51 - (-3.4) = 1.89 eV. The emitted photon has f = 1.89 eV / h = 4.57 x 10^14 Hz, which falls in the visible red (Balmer series).
Spectrum typeAppearanceProduced whenExample
EmissionBright lines on dark backgroundExcited gas emits photonsHydrogen discharge tube
AbsorptionDark lines on continuous backgroundCool gas absorbs from white lightFraunhofer lines in sunlight
15.4

Blackbody radiation

A blackbody absorbs all incident radiation and emits a continuous spectrum that depends only on its temperature. Classical physics predicted infinite intensity at short wavelengths (the ultraviolet catastrophe), but Planck resolved this by assuming light energy is quantized in units of hf. Two key equations describe blackbody behavior: Wien's displacement law gives the peak wavelength, and the Stefan-Boltzmann law gives total emitted power.

  • Wien's displacement law: lambda_max = b / T, where b = 2.898 x 10^-3 m·K. Higher temperature shifts the peak to shorter wavelengths.
  • Stefan-Boltzmann law: P = A sigma T^4, where sigma = 5.67 x 10^-8 W/(m^2·K^4). Total power emitted scales with the fourth power of absolute temperature.
  • Planck's quantization fix: Planck assumed oscillators emit energy only in multiples of hf, eliminating the ultraviolet catastrophe and matching observed spectra.
  • Continuous spectrum: Blackbody radiation spans all wavelengths, unlike atomic line spectra. The shape of the curve shifts and grows with temperature.
  • Temperature must be in Kelvin: Both Wien's law and the Stefan-Boltzmann law require absolute temperature. Convert Celsius to Kelvin before calculating.
The Sun's surface is about 5800 K. Wien's law gives lambda_max = 2.898 x 10^-3 / 5800 = 500 nm, which is green light, consistent with the Sun's peak visible output.
LawEquationWhat it predicts
Wien's displacement lawlambda_max = b/TWavelength of peak emission
Stefan-Boltzmann lawP = A sigma T^4Total power radiated by surface
15.5

The photoelectric effect

When light of sufficient frequency strikes a metal surface, electrons are ejected. The key result is that the maximum kinetic energy of ejected electrons depends on the frequency of light, not its intensity. Increasing intensity increases the number of ejected electrons (current) but not their energy. This behavior is only explained by treating light as photons, each carrying energy hf.

  • Photoelectric equation: K_max = hf - phi, where phi is the work function (minimum energy to eject an electron) and hf is the photon energy.
  • Threshold frequency: f_0 = phi / h. Below this frequency, no electrons are ejected regardless of intensity.
  • Work function: phi is the minimum energy needed to free an electron from the metal surface. It is a material property, measured in eV.
  • Stopping potential: The reverse voltage V_stop needed to halt the fastest ejected electrons: e V_stop = K_max.
  • Intensity vs. frequency: Intensity controls how many photons arrive per second (current), not the energy per photon. Only frequency determines K_max.
Light of frequency 8.0 x 10^14 Hz hits a metal with work function 2.0 eV. K_max = hf - phi = (6.626 x 10^-34)(8.0 x 10^14) / (1.6 x 10^-19) - 2.0 = 3.31 - 2.0 = 1.31 eV.
Variable changedEffect on K_maxEffect on photoelectric current
Increase frequency (above f_0)Increases linearlyNo direct effect
Increase intensityNo effectIncreases (more photons)
Change metal (higher phi)DecreasesMay stop emission if hf < phi
15.6

Compton scattering

In Compton scattering, a photon collides with a free electron and transfers some of its energy and momentum to the electron. The scattered photon emerges with a longer wavelength (lower energy) than the incoming photon. The wavelength shift depends only on the scattering angle theta, not on the photon's initial wavelength. This result is explained by treating the photon as a particle with momentum p = h/lambda and applying conservation of energy and momentum.

  • Compton shift equation: Delta lambda = (h / m_e c)(1 - cos theta), where m_e c = 9.11 x 10^-31 kg and c = 3.00 x 10^8 m/s. The factor h/(m_e c) = 2.43 x 10^-12 m is the Compton wavelength.
  • Scattering angle dependence: At theta = 0 (forward scatter), Delta lambda = 0. At theta = 180 degrees (backscatter), Delta lambda is maximum = 2h/(m_e c).
  • Photon momentum: p = h/lambda = E/c. Photons carry momentum even though they are massless, which is why they can transfer momentum to electrons.
  • Conservation laws applied: Both energy and momentum are conserved in the photon-electron collision, treated as a particle-particle interaction.
  • Evidence for photon particle nature: Classical wave theory predicts no wavelength shift in scattering. The observed shift confirms photons behave as particles with definite momentum.
A photon scatters at theta = 90 degrees. Delta lambda = (h / m_e c)(1 - cos 90) = (2.43 x 10^-12)(1 - 0) = 2.43 x 10^-12 m = 2.43 pm. The scattered photon has a longer wavelength and lower energy.
Scattering angle thetacos thetaDelta lambda
0 degrees (forward)10
90 degrees0h/(m_e c) = 2.43 pm
180 degrees (backscatter)-12h/(m_e c) = 4.86 pm
15.7

Fission, fusion, and radioactive decay kinetics

Nuclear reactions are governed by the strong force, conservation of nucleon number, conservation of charge, conservation of momentum, and mass-energy equivalence. Fusion combines light nuclei into a heavier one, releasing energy because the product is more tightly bound. Fission splits a heavy nucleus into smaller fragments, also releasing energy. Radioactive decay is the spontaneous transformation of an unstable nucleus, and the number of remaining nuclei decreases exponentially over time.

  • Mass-energy equivalence: E = mc^2. Mass defect (the difference between reactant and product masses) converts to released energy in nuclear reactions.
  • Conservation of nucleon number: The total number of protons plus neutrons is the same before and after any nuclear reaction. Use this to balance nuclear equations.
  • Fusion vs. fission: Fusion: small nuclei combine (e.g., deuterium + tritium to helium-4 + neutron). Fission: heavy nucleus splits (e.g., U-235 + neutron to two mid-mass fragments + neutrons). Both release energy.
  • Exponential decay law: N = N_0 e^(-lambda t), where lambda is the decay constant and t is time. The number of nuclei decreases by half every half-life t_{1/2}.
  • Half-life and decay constant: t_{1/2} = ln(2) / lambda = 0.693 / lambda. After n half-lives, N = N_0 / 2^n.
A sample starts with 8.0 x 10^12 nuclei and has a half-life of 10 years. After 30 years (3 half-lives), N = 8.0 x 10^12 / 2^3 = 1.0 x 10^12 nuclei remain.
ProcessWhat happensEnergy released because
FusionTwo light nuclei combineProduct nucleus is more tightly bound per nucleon
FissionHeavy nucleus splitsFragments are more tightly bound per nucleon than parent
Radioactive decayUnstable nucleus emits particle or photonDaughter nucleus is at lower energy state
15.8

Types of radioactive decay

Four decay modes are tested in AP Physics 2. In every case, nucleon number, charge, and lepton number are conserved. Writing and balancing nuclear decay equations requires tracking mass number A and atomic number Z on both sides. Gamma decay does not change A or Z; it only releases energy from a nuclear excited state.

  • Alpha decay: Nucleus emits an alpha particle (He-4, 2 protons + 2 neutrons). A decreases by 4, Z decreases by 2. Example: U-238 to Th-234 + alpha.
  • Beta-minus decay: A neutron converts to a proton; the nucleus emits an electron (beta minus) and an antineutrino. A unchanged, Z increases by 1.
  • Beta-plus decay: A proton converts to a neutron; the nucleus emits a positron (beta plus) and a neutrino. A unchanged, Z decreases by 1.
  • Gamma decay: An excited nucleus releases energy as a high-energy photon (gamma ray). A and Z are unchanged. Often follows alpha or beta decay.
  • Lepton number conservation: In beta decays, a neutrino or antineutrino is emitted to conserve lepton number. Beta-minus emits antineutrino; beta-plus emits neutrino.
Carbon-14 undergoes beta-minus decay: C-14 (Z=6) to N-14 (Z=7) + electron + antineutrino. Check: A = 14 = 14, charge = 6 = 7 + (-1), lepton number conserved by antineutrino.
Decay typeParticle emittedChange in AChange in Z
AlphaHe-4 nucleus-4-2
Beta-minusElectron + antineutrino0+1
Beta-plusPositron + neutrino0-1
GammaPhoton only00

Practice AP Physics 2 unit 15 questions

Try stimulus-based AP practice questions and written prompts after you review the notes.

Example stimulus-based MCQs

open all practice
diagram

Stimulus-based practice question

diagram

The figure shows a nuclear decay sequence for a parent nucleus with mass number A = 220 and atomic number Z = 86. The nucleus first undergoes alpha decay to form Daughter 1, then Daughter 1 undergoes beta-minus decay to form Daughter 2. A student compares the neutron numbers of Daughter 1 and Daughter 2.

Question

Which of the following correctly compares the neutron number N of Daughter 1 to the neutron number N of Daughter 2?

N(Daughter 1) is 1 greater than N(Daughter 2)

N(Daughter 1) is 1 less than N(Daughter 2)

N(Daughter 1) is 2 greater than N(Daughter 2)

N(Daughter 1) equals N(Daughter 2)

graph

Stimulus-based practice question

graph

A student performs a Compton scattering experiment and records the energy of the scattered photon as a function of scattering angle θ. The figure shows the resulting graph. The student claims the data support the particle model of light rather than the classical wave model.

Question

Which choice best evaluates the student's claim using the evidence in the figure?

Supported, because the data show lower photon energy at larger angles.

Supported, because the data show higher photon energy at larger angles.

Not supported, because the wave model predicts this angle dependence from Doppler shift.

Not supported, because any change in photon energy fits both models equally well.

Example FRQs

open all FRQs
FRQ

Photoelectric effect and stopping potential in sodium

1. A laboratory investigates several modern physics phenomena using a hot filament source, a hydrogen gas discharge tube, a clean sodium metal surface in a vacuum photoelectric apparatus, an x-ray source with a graphite target, and a sealed sample of radioactive nuclei, as shown in Figure 1. Light from the filament is approximated as blackbody radiation. The hydrogen discharge tube emits light due to electron transitions between atomic energy levels. Photons from selected sources are directed onto matter to study both particle-like and wave-like behavior of electromagnetic radiation and the quantized behavior of atoms and nuclei.

Figure 1. Five-station modern-physics laboratory: blackbody filament, hydrogen emission spectrum, sodium photoelectric effect, x-ray scattering from graphite, and radioactive decay counting.

A single clean line-art schematic on a landscape page showing five distinct experimental stations arranged in one horizontal row from left to right, equally spaced, with clear whitespace separating stations. Each station is numbered with a bold numeral in a small circle placed just above the main component of that station: 1, 2, 3, 4, 5.

Overall layout and style:
- All components drawn in black line with uniform medium stroke.
- Each station occupies one-fifth of the page width.
- Light or radiation paths are shown with straight arrows indicating direction of travel.
- Every station has exactly one main source component and one measurement component (detector/meter/spectrometer), both labeled.

Station 1 (far left; labeled “1” above it): Hot filament blackbody source
- Draw a small bulb-like enclosure or open housing containing a thin, coiled filament at the center.
- Place the text label “hot filament” directly below the housing.
- Place the text label “T” immediately next to the filament (to the right of the filament coil), indicating its absolute temperature.
- From the filament/housing, draw three diverging straight arrows pointing to the right (a fan shape), labeled collectively with the text “radiation” placed above the arrows.

Station 2 (second from left; labeled “2” above it): Hydrogen discharge tube and spectrometer
- Draw a horizontal glass tube (long cylinder) with electrodes at both ends; label centered under the tube: “hydrogen discharge tube”.
- From the right end of the discharge tube, draw a single straight arrow pointing right into a boxy instrument.
- The instrument is a rectangular box labeled “spectrometer” centered on its face.
- The arrow from the tube terminates at the left face of the spectrometer, clearly showing light entering the spectrometer.

Station 3 (center; labeled “3” above it): Vacuum photoelectric apparatus with sodium cathode and stopping potential
- Draw a sealed cylindrical vacuum tube shown side-on.
- Inside the tube, draw two parallel vertical plates facing each other with a clear gap:
  - Left plate labeled “sodium cathode”.
  - Right plate labeled “anode”.
- From the left side outside the tube, draw a straight arrow labeled “light” pointing into the tube and striking the sodium cathode.
- Between the cathode and anode, draw several small dots representing electrons near the cathode and a single arrow pointing from the cathode toward the anode labeled “electrons” to indicate electron motion direction.
- Below the tube, draw a variable voltage source symbol connected to the two plates with wires.
- Next to the voltage source, place the label “stopping potential Vₛ”.
- Show polarity marking on the voltage source with a “+” on the cathode side connection and a “−” on the anode side connection to indicate a retarding (stopping) configuration (the anode at lower potential than the cathode).

Station 4 (second from right; labeled “4” above it): X-ray source, graphite target, and scattering detector at angle θ
- Draw an x-ray source on the left side of this station as a small box labeled “x-ray source”.
- From the x-ray source, draw a single straight, narrow beam arrow pointing right to a solid block target.
- The target is a small rectangular block labeled “graphite target” centered on the block.
- At the target, show the incoming beam terminating at the target’s left face.
- From the target, draw one outgoing straight arrow representing a scattered x-ray ray directed up and to the right.
- Place a detector (small box) at the end of the scattered ray, labeled “detector”.
- At the target, draw a clear angle marker (curved arc) between the straight continuation of the incident beam direction (imaginary extension to the right) and the scattered ray; label the angle marker with the Greek letter “θ”.

Station 5 (far right; labeled “5” above it): Radioactive sample and decay counter
- Draw a small sealed container (cylinder or capsule) labeled “radioactive sample”.
- To the right of the sample, draw a detector box labeled “detector”.
- Between the sample and detector, draw multiple short straight arrows pointing from the sample to the detector to represent emitted radiation.
- Near the detector, include the text “counts decays” to indicate the measured quantity.

No numerical scales are present in this figure. No extraneous titles. All labels exactly as written: “T”, “hydrogen discharge tube”, “spectrometer”, “sodium cathode”, “anode”, “stopping potential Vₛ”, “x-ray source”, “graphite target”, “detector”, “θ”, “radioactive sample”, “counts decays”.

Figure 2. Intensity I versus wavelength λ for two blackbody filaments; one curve peaks at 970 nm and the other peaks at 580 nm.

A 2D Cartesian graph with no grid lines and two smooth blackbody-like intensity curves.

Axes (all required features present):
- Horizontal axis labeled “wavelength λ (nm)”.
- The x-axis starts at 0 nm at the origin and ends at 1200 nm at the far right end, with tick marks and visible numeric labels every 200 nm: 0, 200, 400, 600, 800, 1000, 1200.
- Vertical axis labeled “intensity I (arbitrary units)”.
- The y-axis starts at 0 at the origin and ends at 10 at the top, with tick marks and visible numeric labels every 2 units: 0, 2, 4, 6, 8, 10.
- The origin is explicitly labeled “0” at the axes intersection.
- Arrowheads appear on the positive end of the x-axis (pointing right) and on the positive end of the y-axis (pointing up).

Curve 1 (the longer-wavelength peak; label must appear on the curve as text “Curve 1”):
- A smooth curve that begins on the x-axis at the origin (intensity zero at λ = 0) with the curve immediately rising above the axis.
- From λ = 0 to the peak, the curve rises steeply at first and then continues rising with a decreasing slope (concave down, ∩-shaped) as it approaches its maximum.
- The curve reaches a single, rounded maximum (horizontal tangent at the top) directly above the x-axis tick labeled 1000, but shifted slightly left so that the peak aligns exactly with the printed value “970” indicated by a short vertical guide mark at λ = 970 nm on the x-axis and the peak centered above that guide mark.
- After the peak, the curve decreases smoothly and continuously (still a smooth curve, concave down immediately after the peak, then gradually becoming less steep) and approaches the x-axis without crossing it.
- By the time λ reaches the right boundary at 1200 nm, the curve is very close to the x-axis but remains slightly above it (intensity positive).

Curve 2 (the shorter-wavelength peak; label must appear on the curve as text “Curve 2”):
- A smooth curve that also begins on the x-axis at the origin and rises above the axis.
- It rises more sharply than Curve 1 for small λ, staying above Curve 1 throughout the left side of the graph.
- It reaches a single rounded maximum (horizontal tangent) exactly above the x-axis tick labeled 600, but shifted slightly left so that the peak aligns exactly with the printed value “580” indicated by a short vertical guide mark at λ = 580 nm on the x-axis and the peak centered above that guide mark.
- The peak height of Curve 2 is higher than the peak height of Curve 1 (Curve 2’s maximum is closer to the y=10 tick than Curve 1’s maximum), making Curve 2 clearly the taller peak.
- After the peak, Curve 2 decreases smoothly, crossing below Curve 1 once on the right side of the graph (the crossing occurs between the 600 nm and 800 nm ticks), and then continues decreasing toward the x-axis.
- At the far right boundary (1200 nm), Curve 2 is closer to zero intensity than Curve 1, remaining slightly above the x-axis.

Additional constraints to remove ambiguity:
- Neither curve ever goes below the x-axis (intensity never negative).
- Each curve has exactly one maximum and no other local extrema.
- Curve labels “Curve 1” and “Curve 2” are placed adjacent to their respective curves near the top half of the plot, not in a legend.
- No title appears.

Numeric accuracy requirements explicitly encoded:
- Curve 1 peak wavelength is exactly 970 nm.
- Curve 2 peak wavelength is exactly 580 nm.

Figure 3. Hydrogen energy levels with a transition from n = 4 to n = 2.

A vertical hydrogen energy-level diagram drawn as four thin horizontal lines stacked from bottom to top on a portrait-oriented panel.

Layout and levels:
- Draw a vertical reference axis line at the far left with the text label “Energy” written parallel to the axis (rotated so it reads bottom-to-top). Add an arrowhead at the top of this axis to indicate increasing energy upward.
- To the right of the axis, draw four horizontal energy level lines of equal length (each line spans roughly half the panel width), aligned vertically one above another with uniform spacing.
- Label each level on the right end of its line (text placed just to the right of the line end):
  - Bottom line labeled “n = 1”.
  - Second line from bottom labeled “n = 2”.
  - Third line from bottom labeled “n = 3”.
  - Top line labeled “n = 4”.

Transition arrow:
- Draw a single straight vertical arrow located near the middle of the level-line lengths (not at the ends), connecting the n = 4 line to the n = 2 line.
- The arrow begins exactly on the n = 4 line and ends exactly on the n = 2 line.
- The arrow points downward (arrowhead at the n = 2 level), visually indicating a drop in energy.
- Place the text “4 → 2” centered next to the arrow shaft.

No additional transitions, no extra numbers, and no wavelength written in this figure.
A.
i.

Complete the following tasks in Figures 2 and 3.

In Figure 2, indicate which curve corresponds to the filament at the higher absolute temperature.

In Figure 3, the transition shown is from n=4n=4 to n=2n=2. Indicate whether the photon is emitted or absorbed during the transition.

ii.

For hydrogen, the energy of level nn is given by En=13.6 eVn2E_n=-\dfrac{13.6\ \text{eV}}{n^2}.

Derive an expression for the wavelength λ42\lambda_{4\to2} of the photon associated with the n=4n=4 to n=2n=2 transition, in terms of fundamental constants. Then calculate λ42\lambda_{4\to2} in nanometers.

Begin your derivation by writing a fundamental physics principle or an equation from the reference information.

Figure 4. Vacuum photoelectric-effect apparatus with sodium cathode, adjustable stopping potential Vₛ, and voltmeter reading at zero current.

A clean schematic of a vacuum photoelectric tube and measurement circuit, arranged left-to-right.

Main tube:
- Draw a horizontal sealed glass vacuum tube (an elongated capsule outline) centered on the page.
- Inside the tube, draw two parallel vertical metal plates facing each other with a gap between them:
  - The left plate is the emitter and is labeled “sodium cathode” with the label placed just below the left plate.
  - The right plate is labeled “anode” with the label placed just below the right plate.
- In the empty space inside the tube between plates, draw several small dots near the cathode and a bold arrow pointing from the cathode toward the anode labeled “photoelectrons” to indicate electron motion when not stopped.

Incoming light:
- On the far left outside the tube, draw a rectangular light source box labeled “monochromatic light”.
- From this light source, draw one straight arrow pointing right into the tube, striking the sodium cathode.
- Place the text “wavelength λ” directly above this incoming arrow.

Electrical circuit and stopping potential:
- Draw wires from the cathode and anode leading downward to an adjustable DC power supply symbol beneath the tube.
- The power supply is labeled “Vₛ” directly above it and also labeled “stopping potential” below it.
- Polarity is explicitly shown to represent a stopping (retarding) potential: mark the cathode-side terminal with a “+” and the anode-side terminal with a “−”, so electrons moving toward the anode are opposed by the electric potential.

Measurement:
- Place a voltmeter symbol (circle with a “V” inside) in parallel with the tube/power supply, with leads connected to the cathode and anode nodes.
- Label the voltmeter “voltmeter” and add adjacent text “reads Vₛ when current is zero”.
- Optionally show a small open switch symbol in series with the tube current path and a label “current = 0 at stopping potential” placed near the circuit path; do not add an ammeter.

Text and cleanliness constraints:
- Only the following symbols/labels appear: “monochromatic light”, “wavelength λ”, “sodium cathode”, “anode”, “photoelectrons”, “Vₛ”, “stopping potential”, “voltmeter”, and “reads Vₛ when current is zero”.
- No numerical values are printed in this figure.
- No background shading; clear black-on-white line art.
B.

Indicate whether the measured stopping potential is consistent with the photoelectric effect model for sodium. Monochromatic light of wavelength λ=350 nm\lambda = 350\ \text{nm} shines on a clean sodium surface in a vacuum photoelectric apparatus, as shown in Figure 4. The work function of sodium is ϕ=2.30 eV\phi = 2.30\ \text{eV}. The stopping potential measured is Vs=0.90 VV_s = 0.90\ \text{V}. Use h=6.63×1034 Jsh = 6.63× 10^{-34}\ \text{J}·\text{s}, c=3.00×10⁸ m/sc = 3.00× 10^8\ \text{m/s}, and 1 eV=1.60×10¹⁹ J1\ \text{eV}=1.60× 10^{-19}\ \text{J}.

Consistent
Not consistent

Justify your answer with a calculation using energy conservation for the photoelectric effect.

FRQ

Photoelectric effect and stopping potential with wavelength

4. A physics student investigates the photoelectric effect using two different monochromatic light sources that illuminate a clean metal surface in a vacuum. Figure 1 shows the experimental setup. The emitted electrons are collected by an electrode, and an adjustable retarding potential difference VsV_s is applied to reduce the current to zero. The student can also change the wavelength of the incident light while keeping the intensity low enough that at most one photon interacts with one electron at a time. The work function of the metal is ϕ=2.20 eV\phi = 2.20\ \text{eV}.

Figure 1. Photoelectric-effect apparatus with adjustable stopping potential V_s (retarding potential) between a clean metal cathode and a collector anode in vacuum; emitted electrons are measured with an ammeter while monochromatic light illuminates the cathode.

Single-panel black-and-white line diagram (no graph axes), drawn as a clear physics apparatus schematic with explicit left-to-right layout and labeled components.

Overall layout (left to right):
1) Light sources and beam path on the far left.
2) A sealed vacuum tube occupying the center of the figure.
3) An external electrical circuit (ammeter plus adjustable DC supply) drawn outside the tube, surrounding the tube from below.

Light-source block (left side):
- Draw two small rectangular boxes stacked vertically, both located entirely to the left of the vacuum tube.
- Label the upper box exactly: "Light source 1 (monochromatic)" and directly beneath it, on a second line inside the same box, show "λ₁ = 350 nm".
- Label the lower box exactly: "Light source 2 (monochromatic)" and directly beneath it, on a second line inside the same box, show "λ₂ = 550 nm".
- To the immediate right of these two boxes, draw a small two-position selector switch symbol (a lever connecting to one of two contacts). Place it midway vertically between the two source boxes.
- Label the switch clearly: "Select source".
- From the right side of the switch, draw a single straight horizontal arrow representing the light beam traveling to the right. The arrow must point directly into the vacuum tube and terminate at the metal cathode surface. Label the arrow above the beam: "monochromatic light".

Vacuum tube (center):
- Draw a large horizontal capsule-shaped outline (a rounded rectangle) representing the evacuated tube, centered in the figure.
- Place the text "vacuum" centered inside the tube, away from the electrodes.
- Inside the tube, draw two parallel vertical plates facing each other:
  - Left plate: the metal emitter (cathode). It is positioned in the left third of the tube interior.
  - Right plate: the collector (anode). It is positioned in the right third of the tube interior.
- Make the plates equal height and aligned horizontally so their facing surfaces are directly opposite each other.
- Label the left plate with text next to it: "metal cathode (clean metal surface)".
- Label the right plate with text next to it: "collector anode".

Illumination point and electron emission:
- The incoming light arrow must strike the inner face of the metal cathode (the face pointing toward the anode).
- From the illuminated face of the cathode, draw multiple small electron symbols (small filled circles with a minus sign or labeled "e⁻") leaving the cathode and traveling horizontally to the right toward the anode.
- Draw these electron trajectories as several thin right-pointing arrows distributed from near the top of the cathode face to near the bottom, all pointing toward the anode.
- Place the label "photoelectrons" above the group of electron arrows.

Electrical connections and stopping-potential polarity (must explicitly show retarding configuration):
- Draw a wire from the cathode plate exiting the tube wall on the left side and continuing downward to the external circuit.
- Draw a wire from the anode plate exiting the tube wall on the right side and continuing downward to the external circuit.
- In the bottom center beneath the tube, draw a DC power supply symbol (battery or adjustable supply) with a clear adjustment knob.
- Label the power supply: "Adjustable retarding potential V_s".
- Show polarity marks at the electrode terminals to indicate retarding potential: place a large "+" sign at the cathode terminal (the left electrode connection) and a large "−" sign at the anode terminal (the right electrode connection). This polarity must be drawn adjacent to the tube connections so it is unambiguous that the cathode is at higher potential than the anode (retarding the electrons).
- Also draw a double-headed potential-difference bracket spanning between the two electrodes (inside the tube or just outside aligned with the plates) labeled exactly "V_s".

Current measurement:
- In series in the external circuit loop, place a circular ammeter symbol on the lower wire segment.
- Put the ammeter circle slightly left of the power supply (still below the tube).
- Label inside the circle: "A".
- Next to the ammeter, add a clear note: "photocurrent".
- Near the ammeter (or near the external circuit), include the text: "Adjust V_s until A reads 0" to indicate the stopping-potential condition.

Visual clarity requirements:
- All labels must be fully spelled and legible.
- Use straight wires with right-angle corners (clean schematic style).
- No extraneous components.
- No numeric scales or axes.
- The only numerical values shown anywhere in the figure are the wavelengths in the light-source boxes: 350 nm and 550 nm (exactly those values), and the symbol V_s (no numeric value for V_s).
A.

Light source 1 has wavelength λ1=350 nm\lambda_1 = 350\ \text{nm} and light source 2 has wavelength λ2=550 nm\lambda_2 = 550\ \text{nm}.

A student claims that the stopping potential VsV_s needed to reduce the current to zero is greater when using light source 1 than when using light source 2.

Indicate whether the student's claim is correct or incorrect. Without manipulating equations, justify your answer by referencing how the energy carried by an individual photon depends on wavelength and how that affects the maximum kinetic energy of the emitted electrons.

B.

Derive an expression for the stopping potential VsV_s as a function of the wavelength λ\lambda of the incident light for this metal. Express your answer in terms of λ\lambda, ϕ\phi, and physical constants, as appropriate. Begin your derivation by writing a fundamental physics principle or an equation from the reference information.

C.

Indicate whether the expression you derived in part B is or is not consistent with your answer from part A. Briefly justify your answer by describing how VsV_s changes when λ\lambda decreases from 550 nm550\ \text{nm} to 350 nm350\ \text{nm}.

FRQ

Photoelectric effect and stopping potential

2. A student investigates the photoelectric effect using a vacuum phototube with a sodium photocathode, as shown in Figure 1. Monochromatic light of adjustable wavelength is incident on the photocathode. The student measures the stopping potential VsV_s needed to reduce the photoelectric current to zero for different wavelengths. The work function of sodium is ϕ=2.30 eV\phi = 2.30\ \text{eV}.

Figure 1. Vacuum phototube photoelectric-effect apparatus with adjustable stopping potential V_s, sodium photocathode, collector, and meters for voltage and photocurrent.

Black-and-white line diagram of a photoelectric-effect circuit and phototube.

Overall layout:
- The phototube is drawn as a horizontal glass bulb centered on the page, occupying the middle half of the figure width. It is an elongated oval (capsule shape) with a clear outline.
- The circuit components (battery, ammeter, voltmeter) are drawn outside the tube below it, connected by straight wires to the two electrodes.

Inside the vacuum phototube (left-to-right placement is mandatory):
1) Photocathode (emitter):
   - A vertical metal plate is drawn inside the left end of the tube, positioned in the left quarter of the tube interior.
   - The plate is slightly curved to match the inner glass outline OR drawn as a straight plate; in either case it must be the left electrode.
   - Label directly next to it: "Sodium photocathode". A shorter secondary label in parentheses immediately after: "(emitter)".

2) Collector plate (anode):
   - A second vertical metal plate is drawn inside the right end of the tube, positioned in the right quarter of the tube interior.
   - It faces the photocathode across the tube.
   - Label directly next to it: "Collector".

3) Electron motion indication:
   - Between the two plates, draw several small arrows pointing from the sodium photocathode toward the collector (left-to-right arrows), indicating emitted electrons traveling to the collector when not fully stopped.
   - No numeric values on these arrows.

Incident light (must show direction and target):
- Draw a beam entering from the far left margin of the figure and striking the sodium photocathode.
- The beam is represented by 3 to 5 parallel horizontal rays with arrowheads pointing right.
- The rays terminate on the left electrode surface (the sodium photocathode), not on the glass.
- Label above the rays: "Monochromatic light".
- Add a second label near the rays: "Adjustable wavelength λ".

Electrical connections (explicit polarity for stopping potential):
- Two wires exit the phototube: one from the sodium photocathode and one from the collector.
- The variable battery is drawn below the tube, centered under the space between the two electrodes.
- The battery symbol has a clearly marked plus and minus sign at its terminals.
- Polarity requirement for stopping potential (retarding potential):
  - The collector must be connected to the negative terminal of the variable battery.
  - The sodium photocathode must be connected to the positive terminal of the variable battery.
  - Next to the battery, label: "Variable battery".
  - Near the wires leading to the electrodes, place a label: "Stopping potential V_s".

Meters (must show correct series/parallel placement):
1) Ammeter (photocurrent):
   - Place a circular meter symbol labeled "A" in series in the external wire loop (not across the electrodes).
   - It is located on the lower left segment of the circuit wire, between the battery and the sodium photocathode connection.
   - Label below the circle: "Ammeter" and to the side: "photocurrent".

2) Voltmeter (measures V_s):
   - Place a circular meter symbol labeled "V" connected in parallel across the two electrodes (i.e., one lead to the collector connection and the other lead to the photocathode connection).
   - Draw it as a circle below the tube but above the battery so its two leads clearly attach to the two electrode nodes.
   - Label below the circle: "Voltmeter".

Wire clarity rules:
- Use straight-line wires with right-angle corners.
- All connection points to the electrodes are shown as solid dots.
- No extra components are shown.

Visible text that must appear exactly:
- "Monochromatic light"
- "Adjustable wavelength λ"
- "Sodium photocathode (emitter)"
- "Collector"
- "Variable battery"
- "Stopping potential V_s"
- Meter labels: "A" inside ammeter circle and "V" inside voltmeter circle; words "Ammeter" and "Voltmeter" next to the respective symbols.

No numerical values are printed anywhere in Figure 1.
A.

Construct an energy diagram (energy on a vertical axis) that represents the interaction of a single photon with the sodium surface for this trial. Your diagram must include and label (i) the incident photon energy EγE_\gamma, (ii) the work function ϕ\phi of the metal, and (iii) the maximum kinetic energy KmaxK_{\max} of the emitted electron as inferred from the stopping potential. During one trial, the incident light has wavelength λ=365 nm\lambda = 365\ \text{nm} and the stopping potential is measured to be Vs=1.10 VV_s = 1.10\ \text{V}.

B.

Derive an expression for the stopping potential VsV_s in terms of λ\lambda, ϕ\phi, and physical constants, as appropriate. Begin your derivation by writing a fundamental physics principle or an equation from the reference information. Assume the maximum kinetic energy of emitted electrons is related to the stopping potential by Kmax=eVsK_{\max} = eV_s and photon energy is Eγ=hc/λE_\gamma = hc/\lambda.

Figure 2. Axes for graphing stopping potential V_s as a function of inverse wavelength 1/λ for the photoelectric effect.

A blank Cartesian graph (no plotted data points) with fully numbered axes and arrowheads.

Axes placement and styling:
- Horizontal x-axis is a solid black line with an arrowhead on the far right (positive direction).
- Vertical y-axis is a solid black line with an arrowhead at the top (positive direction).
- The axes intersect at the lower-left corner region, forming the origin.
- The origin is explicitly labeled with the numeral "0" placed immediately next to the intersection.
- No grid lines.

X-axis (inverse wavelength):
- Axis label centered below the x-axis: "1/λ (10^6 m^-1)".
- The x-axis runs from 0 to 8 with evenly spaced tick marks.
- Tick marks and labels at every 1 unit: 0, 1, 2, 3, 4, 5, 6, 7, 8.
- The numeral labels are placed below their corresponding tick marks.

Y-axis (stopping potential):
- Axis label rotated vertically along the y-axis: "V_s (V)".
- The y-axis runs from -1 to 4 with evenly spaced tick marks.
- Tick marks and labels at intervals of 1 volt: -1, 0, 1, 2, 3, 4.
- The numeral labels are placed to the left of their corresponding tick marks.

Blank plotting region:
- The interior region contains no line, no points, and no annotations; it is intentionally empty for students to sketch.

Required axis-end arrows:
- A single arrowhead at the positive end of the x-axis (right end).
- A single arrowhead at the positive end of the y-axis (top end).

No title appears above the graph and no additional text appears inside the plotting area.
C.

On the axes provided in Figure 2, sketch the expected relationship between VsV_s and 1/λ1/\lambda for wavelengths that produce photoelectrons. Draw a straight best-fit line with an arrow indicating the direction of increasing photon energy. Label the physical meaning of (i) the slope and (ii) the VsV_s-axis intercept in terms of fundamental constants and/or ϕ\phi. The student repeats the experiment for several wavelengths and chooses to graph VsV_s versus 1/λ1/\lambda to create a linear representation.

D.

Indicate which source, if either, will produce emitted photoelectrons from the sodium surface. The student considers using two different light sources on the same sodium photocathode.

Source 1: monochromatic light of wavelength λ=540 nm\lambda = 540\ \text{nm} with intensity I1=2.0 mWcm2I_1 = 2.0\ \text{mW}\,\text{cm}^{-2}.

Source 2: monochromatic light of wavelength λ=365 nm\lambda = 365\ \text{nm} with a lower intensity I2=0.50 mWcm2I_2 = 0.50\ \text{mW}\,\text{cm}^{-2}.

Assume the photocathode area illuminated is the same for both sources and the work function remains ϕ=2.30 eV\phi = 2.30\ \text{eV}.

Source 1 only
Source 2 only
Both sources
Neither source

Briefly justify your answer by referencing at least one feature of your answers to parts A, B, or C.

Key terms

TermDefinition
Photon energyThe energy carried by a single photon, equal to hf, where h is Planck's constant and f is the photon's frequency. Used in photoelectric effect, spectra, and Compton scattering calculations.
quantizationThe property that energy and momentum take only discrete values for bound systems. Explains why atomic spectra show lines rather than a continuous range of frequencies.
ground stateThe lowest allowed energy state of an atom (n = 1 for hydrogen, E = -13.6 eV). An electron in the ground state requires the most energy to be ionized.
excited stateAny allowed energy state above the ground state. An electron in an excited state can spontaneously emit a photon and drop to a lower level.
threshold frequencyThe minimum photon frequency needed to eject an electron from a metal surface via the photoelectric effect. Below this frequency, no electrons are emitted regardless of light intensity.
Maximum kinetic energyThe kinetic energy of the fastest electrons ejected in the photoelectric effect, given by K_max = hf - phi. Increases linearly with photon frequency above the threshold.
photon momentumThe momentum carried by a photon: p = h/lambda = E/c. Photons transfer momentum to electrons in Compton scattering, explaining the observed wavelength shift.
Wien's lawlambda_max = b/T, where b = 2.898 x 10^-3 m·K. Gives the peak wavelength of a blackbody spectrum; higher temperature shifts the peak to shorter wavelengths.
Stefan-Boltzmann lawP = A sigma T^4. The total power radiated by a blackbody surface scales with the fourth power of absolute temperature. Temperature must be in Kelvin.
continuous spectrumA spectrum with intensity distributed across all wavelengths, as emitted by a blackbody. Contrasts with the discrete line spectrum produced by atomic transitions.
nucleonA proton or neutron in the nucleus. Nucleon number (mass number A) is conserved in all nuclear reactions and decay processes.
lepton numberA conserved quantity in nuclear decays. Beta-minus decay produces an antineutrino; beta-plus decay produces a neutrino, each to keep lepton number balanced.

Common unit 15 mistakes

Confusing intensity and frequency in the photoelectric effect

Increasing light intensity increases the number of ejected electrons (current) but does not change K_max. Only increasing frequency above the threshold raises K_max. A common error is predicting that brighter light ejects faster electrons.

Using Celsius instead of Kelvin in blackbody equations

Both Wien's law and the Stefan-Boltzmann law require absolute temperature in Kelvin. Plugging in a Celsius value gives a completely wrong answer. Always convert: T(K) = T(C) + 273.

Forgetting to conserve both A and Z in nuclear equations

Students often balance mass number A but forget to check atomic number Z, or vice versa. In every nuclear reaction and decay, both the total nucleon count and total charge must be equal on both sides.

Misidentifying which decay type changes A vs. Z

Alpha decay changes both A (by -4) and Z (by -2). Beta decays change only Z (by +1 or -1) while A stays the same. Gamma decay changes neither. Mixing these up leads to wrong daughter nuclei.

Applying the Compton shift formula to bound electrons

The Compton shift equation Delta lambda = (h/m_e c)(1 - cos theta) applies to photon collisions with free electrons. For tightly bound electrons, the photon scatters without a wavelength shift (Thomson scattering). Using the Compton formula in the wrong context is a frequent error.

How this unit shows up on the AP exam

Explaining phenomena qualitatively before calculating

AP Physics 2 free-response questions frequently ask you to explain why a phenomenon occurs before or instead of calculating a numerical answer. For Unit 15, this means being able to state why increasing light intensity does not increase K_max in the photoelectric effect, why the Compton shift depends on scattering angle, or why classical physics predicted the ultraviolet catastrophe. Practice writing one-to-two sentence explanations that name the physical principle (quantization, photon model, conservation of momentum) and connect it directly to the observation.

Balancing nuclear equations and applying conservation laws

Multiple-choice and free-response items in Unit 15 commonly require you to complete or verify a nuclear equation by conserving nucleon number and charge. You may be given a decay or reaction with one unknown particle and asked to identify it, or asked to explain which conservation law rules out a proposed reaction. Practice writing balanced equations for all four decay types and for fission and fusion reactions, checking both A and Z on each side.

Connecting graphs and diagrams to quantum concepts

Unit 15 exam questions often present an energy level diagram, a blackbody intensity-wavelength curve, or a photoelectric effect graph (K_max vs. frequency) and ask you to extract information or make predictions. For energy level diagrams, practice identifying the transition that produces a given photon wavelength. For blackbody curves, practice reading off peak wavelength and predicting how the curve shifts with temperature. For photoelectric graphs, practice finding work function from the x-intercept and Planck's constant from the slope.

Final unit 15 review checklist

  • Unit 15 final review checklistUse this list to confirm you can handle every major skill in Unit 15 before the exam.
  • Apply E = hf and lambda = h/pCalculate photon energy from frequency, photon frequency from wavelength, and de Broglie wavelength from a particle's momentum or kinetic energy.
  • Use the Bohr model for hydrogenCalculate energy levels with E_n = -13.6 eV / n^2, find ionization energy from any level, and identify ground state vs. excited states.
  • Interpret energy level diagramsIdentify emission and absorption transitions, calculate photon energy and wavelength for a given transition, and explain why each element has a unique spectrum.
  • Apply Wien's law and Stefan-Boltzmann lawFind peak wavelength from temperature and total radiated power from surface area and temperature. Always use Kelvin.
  • Solve photoelectric effect problemsUse K_max = hf - phi to find maximum kinetic energy, threshold frequency, work function, or stopping potential given the other quantities.
  • Calculate Compton wavelength shiftsApply Delta lambda = (h/m_e c)(1 - cos theta) for a given scattering angle and explain why the scattered photon has lower energy and longer wavelength.
  • Balance nuclear equations and apply decay kineticsWrite balanced equations for fission, fusion, and all four decay types. Use N = N_0 e^(-lambda t) and t_{1/2} = 0.693/lambda to find remaining nuclei or elapsed time.

How to study unit 15

Step 1: Build the quantum foundation (Topics 15.1-15.3)Start with wave-particle duality and photon energy (E = hf, lambda = h/p). Then work through the Bohr model energy levels (E_n = -13.6 eV / n^2) and practice reading energy level diagrams to identify emission and absorption transitions. Use the topic guides for 15.1, 15.2, and 15.3 to check your understanding of each concept before moving on.
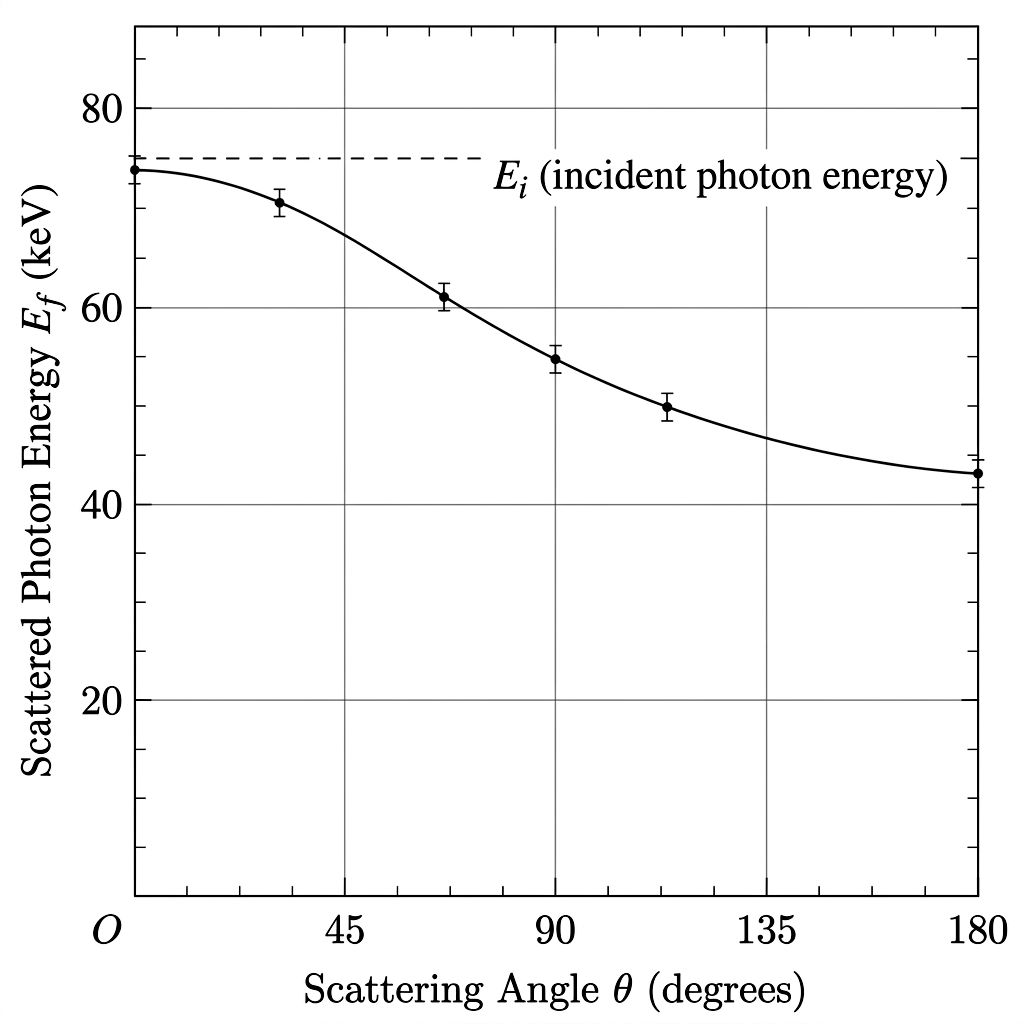
Step 2: Understand the three quantum phenomena (Topics 15.4-15.6)Work through blackbody radiation (Wien's law and Stefan-Boltzmann law), the photoelectric effect (K_max = hf - phi, threshold frequency, stopping potential), and Compton scattering (Delta lambda = (h/m_e c)(1 - cos theta)) in sequence. For each, practice explaining why classical physics fails and how the quantum model resolves the problem. Use available practice questions to test your equation fluency.
Step 3: Apply conservation laws to nuclear reactions (Topic 15.7)Practice balancing fission and fusion equations by conserving nucleon number and charge. Apply E = mc^2 to find energy released from mass defect. Then work decay kinetics problems using N = N_0 e^(-lambda t) and the half-life relation t_{1/2} = 0.693/lambda. The topic guide for 15.7 and FRQ practice are useful here.
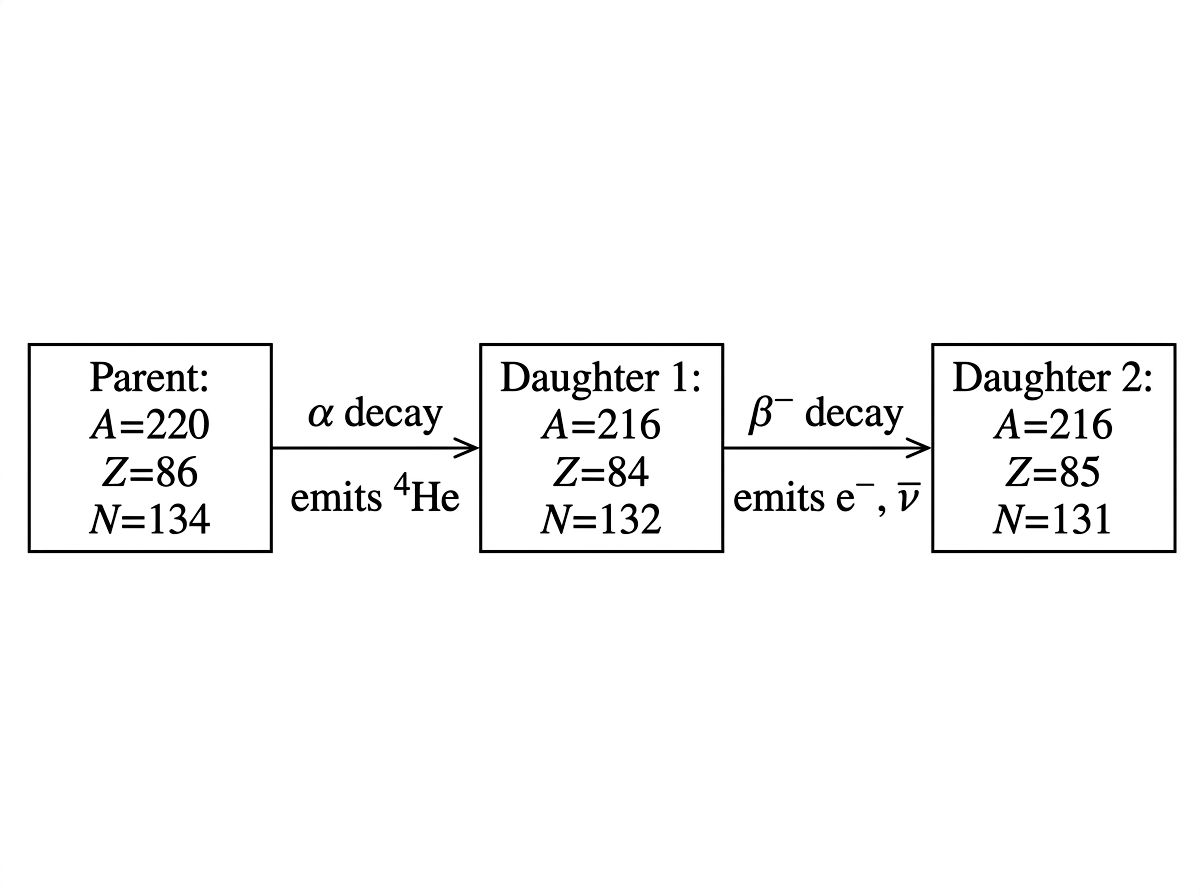
Step 4: Write and balance all four decay types (Topic 15.8)Drill alpha, beta-minus, beta-plus, and gamma decay equations until you can write the daughter nucleus and emitted particles from memory. Check that A, Z, and lepton number are conserved in each. Use the topic guide for 15.8 and practice questions to test your ability to identify decay type from a given nuclear equation.
Step 5: Integrate and estimate your scoreReview the key terms and the comparison tables across all topics. Work through mixed practice questions covering the full unit. Use the AP score calculator to estimate your estimated score range and identify which topic areas still need focused review.

More ways to review

Topic study guides

Open the individual guides for Unit 15 when you want a closer review of one topic.

browse guides

Practice questions

Use AP-style practice after you review the notes so you can check what you understand.

start practice

FRQ practice

Practice free-response reasoning and compare your answer with scoring guidance.

practice FRQs

Cheatsheets

Use unit cheatsheets for a quick visual review after you work through the notes.

open cheatsheets

Score calculator

Estimate your broader AP score goal after you review the course and exam format.

open calculator

Frequently Asked Questions

What topics are covered in AP Physics 2 Unit 15?

AP Physics 2 Unit 15 covers 8 topics in Modern Physics: Quantum Theory and Wave-Particle Duality, the Bohr Model of Atomic Structure, Emission and Absorption Spectra, Blackbody Radiation, the Photoelectric Effect, Compton Scattering, Fission, Fusion, and Nuclear Decay, and Types of Radioactive Decay. Together these topics explain how quantum theory replaced classical physics at the atomic and subatomic scale. See all 8 topics at /ap-physics-2-revised/unit-15.

How much of the AP Physics 2 exam is Unit 15?

Unit 15: Modern Physics makes up 12-15% of the AP Physics 2 exam, making it one of the more heavily weighted units. It covers quantum theory, the photoelectric effect, atomic structure, nuclear decay, fission, and fusion. Expect several multiple-choice questions and potential FRQ components drawn from these topics on exam day.

What's on the AP Physics 2 Unit 15 progress check (MCQ and FRQ)?

The AP Physics 2 Unit 15 progress check includes both MCQ and FRQ parts drawn from all 8 Modern Physics topics. The MCQ section tests conceptual understanding of the photoelectric effect, Compton scattering, blackbody radiation, atomic structure, and nuclear decay. The FRQ part asks you to apply quantum theory reasoning, interpret spectra, or work through nuclear processes quantitatively. Practice with matched questions at /ap-physics-2-revised/unit-15.

How do I practice AP Physics 2 Unit 15 FRQs?

The best way to practice AP Physics 2 Unit 15 FRQs is to focus on the topics that generate the most free-response questions: the photoelectric effect, emission and absorption spectra, and nuclear decay processes. FRQs in this unit typically ask you to explain phenomena using quantum theory, calculate photon energy or stopping voltage, or analyze nuclear equations. Practice by writing out full explanations, not just plugging numbers, since College Board awards points for reasoning. Find Unit 15 FRQ practice at /ap-physics-2-revised/unit-15.

Where can I find AP Physics 2 Unit 15 practice questions?

For AP Physics 2 Unit 15 practice questions, including multiple-choice and practice test sets, head to /ap-physics-2-revised/unit-15. There you'll find MCQ practice covering the photoelectric effect, Bohr model, Compton scattering, blackbody radiation, and nuclear decay, plus FRQ-style problems. Mixing MCQ and FRQ practice is the most effective way to prepare for the 12-15% of exam questions this unit represents.

How should I study AP Physics 2 Unit 15?

Start with the photoelectric effect and quantum theory since those concepts anchor everything else in Unit 15. Once you understand wave-particle duality and discrete energy levels, the Bohr model of atomic structure and emission spectra will click into place. From there, work through Compton scattering and blackbody radiation, then finish with fission, fusion, and radioactive decay. A few concrete steps that help: draw energy-level diagrams for the Bohr model, practice writing and balancing nuclear equations for decay types, and do timed MCQ sets to reinforce the conceptual reasoning College Board tests. Unit 15 is 12-15% of the exam, so it's worth steady, spaced review rather than a last-minute cram. Find study resources at /ap-physics-2-revised/unit-15.

Ready to review Unit 15?Start with the notes, check the topic cards, and use the practice or resource links when they are available for this course.