🎳Intro to Econometrics Unit 1 Review
1.4 Hypothesis testing
1.4 Hypothesis testing
Unit & Topic Study Guides
Probability & Statistics Fundamentals
Linear Regression: Simple and Multiple
Econometric Model Design
Gauss-Markov Assumptions & OLS Properties
Hypothesis Tests & Confidence Intervals
Dummy Variables & Selection Models
Multicollinearity & Heteroskedasticity
Autocorrelation in Time Series Analysis
Instrumental Variables & Two-Stage LS
Panel Data Models & Fixed Effects
Limited Dependent Variable Models
Econometric Software: Tools and Applications
Hypothesis testing is a crucial statistical method in econometrics for making decisions about population parameters based on sample data. It involves comparing null and alternative hypotheses to determine which is more likely to be true given the observed data.
This topic covers the fundamentals of hypothesis testing, including types of tests, significance levels, and critical values. It also explores test statistics, conducting hypothesis tests, interpreting p-values, and constructing confidence intervals. Understanding these concepts is essential for analyzing economic theories and relationships.
Hypothesis testing fundamentals
- Hypothesis testing is a statistical method used to make decisions about population parameters based on sample data
- It involves comparing a null hypothesis () with an alternative hypothesis () to determine which is more likely to be true given the observed data
- Hypothesis testing is a cornerstone of inferential statistics and is widely used in econometrics to test economic theories, compare means, analyze variance, and examine relationships between variables
Null and alternative hypotheses
- The null hypothesis () represents the status quo or default position, often stating that there is no significant difference or relationship between variables
- The alternative hypothesis () represents the claim or research question being tested, suggesting that there is a significant difference or relationship
- Examples:
- : The average income of two countries is equal ()
- : The average income of two countries is not equal ()
One-tailed vs two-tailed tests
- One-tailed tests are used when the alternative hypothesis specifies a direction (greater than or less than) for the difference or relationship
- Two-tailed tests are used when the alternative hypothesis does not specify a direction, only that there is a difference or relationship
- The choice between one-tailed and two-tailed tests depends on the research question and prior knowledge about the direction of the effect
- Examples:
- One-tailed: : The average income in Country A is greater than in Country B ()
- Two-tailed: : The average income in Country A is different from Country B ()
Significance level and critical values
- The significance level () is the probability of rejecting the null hypothesis when it is true (Type I error)
- Common significance levels are 0.01, 0.05, and 0.10, with 0.05 being the most widely used
- Critical values are the threshold values that the test statistic must exceed to reject the null hypothesis at a given significance level
- Critical values are determined by the significance level, sample size, and the distribution of the test statistic under the null hypothesis
Types of errors in hypothesis testing
- Type I error (false positive): Rejecting the null hypothesis when it is true
- The probability of a Type I error is equal to the significance level ()
- Type II error (false negative): Failing to reject the null hypothesis when it is false
- The probability of a Type II error is denoted by and is related to the power of the test ()
- The goal is to minimize both types of errors, but there is a trade-off between them
- Increasing the sample size or choosing a more appropriate test can help reduce the probability of both types of errors
Test statistics and distributions
- Test statistics are calculated from sample data and used to make decisions about population parameters in hypothesis testing
- The distribution of the test statistic under the null hypothesis determines the critical values and p-values
- Different test statistics are used depending on the type of data, sample size, and assumptions about the population distribution
- Common test statistics in econometrics include z-test, t-test, F-test, and chi-square test
z-test for population mean
- The z-test is used to test hypotheses about a population mean when the population standard deviation is known and the sample size is large (typically n > 30)
- The test statistic is calculated as: , where is the sample mean, is the hypothesized population mean, is the population standard deviation, and is the sample size
- The z-test assumes that the population is normally distributed or the sample size is large enough for the Central Limit Theorem to apply
t-test for sample mean
- The t-test is used to test hypotheses about a population mean when the population standard deviation is unknown and is estimated from the sample data
- The test statistic is calculated as: , where is the sample standard deviation
- The t-test assumes that the population is normally distributed or the sample size is large enough for the Central Limit Theorem to apply
- The t-distribution has heavier tails than the standard normal distribution and depends on the degrees of freedom ()
F-test for equality of variances
- The F-test is used to test hypotheses about the equality of variances between two populations
- The test statistic is calculated as: , where and are the sample variances of the two populations
- The F-test assumes that the populations are normally distributed and independent
- The F-distribution is right-skewed and depends on the degrees of freedom for the numerator and denominator
Chi-square test for independence
- The chi-square test is used to test hypotheses about the independence between two categorical variables
- The test statistic is calculated as: , where is the observed frequency and is the expected frequency under the null hypothesis of independence
- The chi-square test assumes that the expected frequencies are not too small (typically, at least 80% of the expected frequencies should be greater than 5)
- The chi-square distribution is right-skewed and depends on the degrees of freedom (, where and are the number of rows and columns in the contingency table)

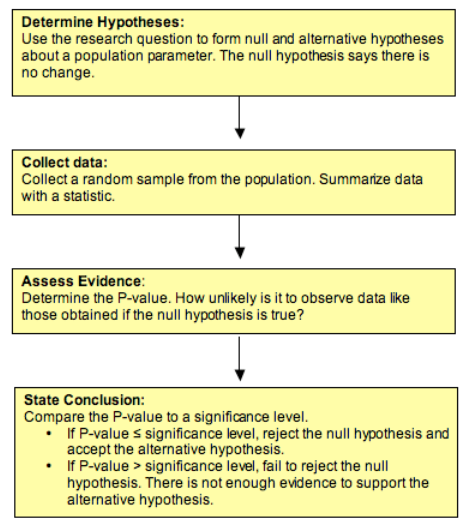
Conducting hypothesis tests
- Hypothesis testing involves a systematic process of stating hypotheses, calculating test statistics, comparing them to critical values, and making decisions based on the results
- The process ensures that the decisions are based on objective criteria and helps to control the probability of making errors
- Conducting hypothesis tests is a crucial skill in econometrics, as it allows researchers to draw conclusions about economic theories and relationships based on empirical evidence
Stating hypotheses and assumptions
- Clearly state the null and alternative hypotheses in terms of population parameters
- Identify the type of test (one-tailed or two-tailed) based on the research question and prior knowledge
- Check the assumptions of the test, such as normality, independence, and equality of variances, and consider alternative tests if the assumptions are violated
- Example:
- : The average hourly wage of male and female employees is equal ()
- : The average hourly wage of male employees is higher than female employees ()
- Assumptions: independent samples, normally distributed populations or large sample sizes
Calculating test statistics
- Select the appropriate test statistic based on the type of data, sample size, and assumptions
- Calculate the test statistic using the sample data and the formulas specific to the chosen test
- Double-check the calculations and ensure that the correct values are used
- Example: For a t-test comparing the average hourly wage of male and female employees, calculate the t-statistic using the sample means, sample standard deviations, and sample sizes
Comparing test statistics to critical values
- Determine the critical values based on the significance level, degrees of freedom, and the type of test (one-tailed or two-tailed)
- Compare the calculated test statistic to the critical values
- If the test statistic falls in the rejection region (i.e., is more extreme than the critical values), reject the null hypothesis; otherwise, fail to reject the null hypothesis
- Example: If the calculated t-statistic is greater than the critical value for a one-tailed test at the 0.05 significance level, reject the null hypothesis that the average hourly wage is equal for male and female employees
Making decisions and conclusions
- Make a decision to reject or fail to reject the null hypothesis based on the comparison of the test statistic to the critical values
- Interpret the results in the context of the research question and the real-world implications
- Consider the limitations of the study, such as sample size, representativeness, and potential confounding variables
- Example: If the null hypothesis is rejected, conclude that there is sufficient evidence to support the claim that male employees have a higher average hourly wage than female employees, and discuss the potential factors contributing to this difference
P-values and confidence intervals
- P-values and confidence intervals are alternative approaches to hypothesis testing that provide additional information about the strength of evidence and the precision of estimates
- P-values represent the probability of observing a test statistic as extreme as or more extreme than the one calculated from the sample data, assuming the null hypothesis is true
- Confidence intervals provide a range of plausible values for the population parameter, with a specified level of confidence
- Both p-values and confidence intervals are widely used in econometrics to report the results of hypothesis tests and to convey the uncertainty associated with the estimates
Interpreting p-values
- The p-value is the probability of observing a test statistic as extreme as or more extreme than the one calculated from the sample data, assuming the null hypothesis is true
- A small p-value (typically less than 0.05) indicates strong evidence against the null hypothesis, while a large p-value indicates weak evidence against the null hypothesis
- P-values do not provide information about the size or practical significance of the effect, only the strength of evidence against the null hypothesis
- Example: A p-value of 0.01 means that there is a 1% chance of observing a test statistic as extreme as or more extreme than the one calculated, if the null hypothesis is true
Relationship between p-values and significance level
- The significance level () is the threshold for deciding whether to reject the null hypothesis
- If the p-value is less than the significance level, the null hypothesis is rejected; otherwise, the null hypothesis is not rejected
- The choice of the significance level is based on the acceptable level of Type I error and is determined before conducting the test
- Example: If the p-value is 0.03 and the significance level is 0.05, the null hypothesis is rejected, as there is sufficient evidence against it
Constructing confidence intervals
- A confidence interval is a range of values that is likely to contain the true population parameter with a specified level of confidence
- The level of confidence (e.g., 95%) represents the proportion of times the confidence interval would contain the true population parameter if the sampling process were repeated many times
- Confidence intervals are constructed using the sample estimate, the standard error, and the critical values from the appropriate distribution (e.g., z-distribution or t-distribution)
- Example: A 95% confidence interval for the average hourly wage of employees in a company might be ($18.50, $22.00), meaning that we are 95% confident that the true average hourly wage falls within this range
Confidence intervals vs hypothesis tests
- Confidence intervals and hypothesis tests are related but provide different information
- Hypothesis tests focus on deciding whether to reject or fail to reject a specific null hypothesis based on the sample data
- Confidence intervals provide a range of plausible values for the population parameter, without specifying a particular null hypothesis
- If a confidence interval does not contain the value specified in the null hypothesis, the null hypothesis is rejected at the corresponding significance level
- Example: If a 95% confidence interval for the difference in average hourly wage between male and female employees does not contain zero, we can reject the null hypothesis of no difference at the 0.05 significance level
Hypothesis testing applications in econometrics
- Hypothesis testing is a fundamental tool in econometrics, used to test economic theories, compare means, analyze variance, and examine relationships between variables
- Econometric models often involve multiple variables and require specialized tests, such as t-tests for regression coefficients, F-tests for overall model significance, and chi-square tests for model specification
- Hypothesis testing in econometrics helps researchers to draw conclusions about economic phenomena based on empirical evidence and to make policy recommendations based on the results
Testing economic theories and models
- Economic theories often generate testable hypotheses about the relationships between variables or the effects of policy interventions
- Hypothesis testing allows researchers to confront these theories with empirical data and to determine whether the data support or refute the theoretical predictions
- Examples:
- Testing the efficient market hypothesis by examining the predictability of stock returns
- Evaluating the effectiveness of minimum wage laws by comparing employment levels before and after the implementation of the policy
Comparing means of economic variables
- Comparing the means of economic variables across different groups or time periods is a common application of hypothesis testing in econometrics
- T-tests and ANOVA (analysis of variance) are used to test hypotheses about the equality of means
- Examples:
- Comparing the average GDP growth rates of developed and developing countries
- Analyzing the difference in average consumer spending before and after a recession
Analyzing variance in economic data
- Analyzing the variance in economic data helps researchers to understand the sources of variation and to identify potential heterogeneity in the relationships between variables
- F-tests and Levene's test are used to test hypotheses about the equality of variances
- Examples:
- Examining the variance in income inequality across different regions or countries
- Testing for heteroskedasticity in regression models, which can affect the efficiency of the estimates
Testing for independence in economic relationships
- Testing for independence between economic variables is important for identifying potential confounding factors and for ensuring the validity of regression models
- Chi-square tests and correlation tests are used to test hypotheses about the independence of variables
- Examples:
- Testing for the independence of consumer preferences and advertising expenditure
- Examining the relationship between education level and income, while controlling for other factors such as age and occupation
Common pitfalls and best practices
- Hypothesis testing is a powerful tool in econometrics, but it is also subject to misuse and misinterpretation
- Researchers should be aware of the common pitfalls and follow best practices to ensure the validity and reliability of their results
- Proper application of hypothesis testing requires a clear understanding of the assumptions, limitations, and interpretations of the tests, as well as an awareness of the potential sources of bias and error
Choosing appropriate test and hypotheses
- Select the appropriate test based on the type of data, sample size, and assumptions about the population distribution
- Clearly state the null and alternative hypotheses in terms of population parameters, and ensure that they are mutually exclusive and exhaustive
- Avoid multiple testing problems by pre-specifying the hypotheses and using appropriate adjustments for multiple comparisons
- Example: Use a t-test for comparing means when the population standard deviation is unknown, and use a z-test when the population standard deviation is known
Checking assumptions and conditions
- Check the assumptions of the test, such as normality, independence, and equality of variances, and consider alternative tests if the assumptions are violated
- Use diagnostic plots and formal tests to assess the assumptions, such as the Shapiro-Wilk test for normality and the Levene's test for equality of variances
- Be transparent about any violations of assumptions and discuss the potential impact on the results
- Example: If the normality assumption is violated, consider using a non-parametric test, such as the Wilcoxon rank-sum test, instead of a t-test
Avoiding Type I and Type II errors
- Balance the risks of Type I and Type II errors by choosing an appropriate significance level and sample size
- Consider the practical significance of the effect size in addition to the statistical significance
- Use power analysis to determine the required sample size for detecting a meaningful effect with a desired level of power
- Example: If the consequences of a Type I error are severe (e.g., in medical research), use a lower significance level, such as 0.01, to reduce the risk of false positives
Interpreting results in context of research question
- Interpret the results of hypothesis tests in the context of the research question and the real-world implications
- Avoid drawing causal conclusions from observational data, as hypothesis tests only establish associations between variables
- Consider the limitations of the study, such as sample size, representativeness, and potential confounding variables, when interpreting the results
- Example: If a hypothesis test reveals a significant difference in average income between two groups, discuss the potential factors contributing to this difference and the policy implications, rather than simply stating that one group earns more than the other