Goodness-of-fit tests help us figure out if our data matches a specific probability distribution. These tests compare what we see in our data to what we'd expect if it followed a certain pattern. They're super useful in many fields, from quality control to social sciences.
There are different types of goodness-of-fit tests for different kinds of data. The chi-square test works well for categorical stuff, while the Kolmogorov-Smirnov test is great for continuous data. Knowing which test to use and how to interpret the results is key to understanding your data better.
Goodness-of-Fit Tests: Purpose and Application
Understanding Goodness-of-Fit Tests
- Goodness-of-fit tests are statistical methods used to determine how well a hypothesized probability distribution fits a set of observed data
- Compare the observed frequencies of data points in different categories or intervals with the expected frequencies based on the hypothesized distribution
- The null hypothesis states that the observed data follow the specified distribution, while the alternative hypothesis suggests that the data do not follow the distribution
- Used in various fields (quality control, biology, social sciences) to assess the agreement between empirical data and theoretical models
Choosing the Appropriate Goodness-of-Fit Test
- The choice of the appropriate goodness-of-fit test depends on the nature of the data and the hypothesized distribution
- For categorical data, the chi-square goodness-of-fit test is commonly used
- For continuous data, the Kolmogorov-Smirnov (K-S) test is a suitable choice
- Consider the assumptions of each test, such as the independence of observations and the minimum expected frequency in each category (chi-square test)
- Ensure that the hypothesized distribution's parameters are fully specified or estimated from the data using a separate method (K-S test)
Chi-Square Test for Categorical Data
Calculating the Chi-Square Test Statistic
- The chi-square goodness-of-fit test assesses the agreement between observed categorical data and a hypothesized discrete probability distribution
- Calculate the test statistic as the sum of the squared differences between the observed and expected frequencies, divided by the expected frequencies for each category
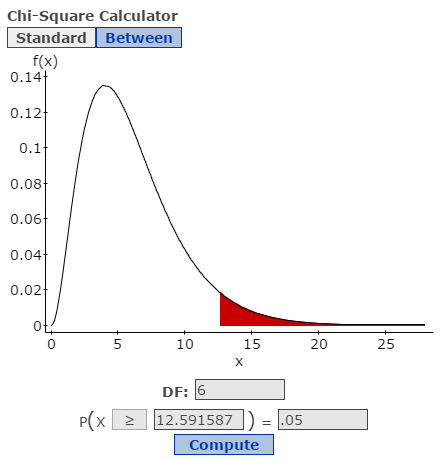
- The test statistic follows a chi-square distribution with degrees of freedom equal to the number of categories minus one, assuming the hypothesized distribution is fully specified

Interpreting the Chi-Square Test Results
- Calculate the p-value by comparing the test statistic to the chi-square distribution with the appropriate degrees of freedom
- If the p-value is less than the chosen significance level (0.05), reject the null hypothesis, indicating that the observed data do not follow the hypothesized distribution
- Consider the practical significance of the findings and the assumptions of the test, such as the independence of observations and the minimum expected frequency in each category
- If the null hypothesis is rejected, consider alternative distributions or models that may better describe the observed data
Kolmogorov-Smirnov Test for Continuous Data
Applying the Kolmogorov-Smirnov Test
- The Kolmogorov-Smirnov (K-S) test is a nonparametric goodness-of-fit test used to assess the agreement between observed continuous data and a hypothesized continuous probability distribution
- Compare the empirical cumulative distribution function (ECDF) of the observed data with the cumulative distribution function (CDF) of the hypothesized distribution
- The test statistic for the K-S test is the maximum absolute difference between the ECDF and the CDF, denoted as D
Determining the Critical Values and Interpreting Results
- The critical values for the K-S test are based on the sample size and the desired significance level, and they can be obtained from tables or statistical software
- If the test statistic D exceeds the critical value, reject the null hypothesis, indicating that the observed data do not follow the hypothesized distribution
- The K-S test is sensitive to differences in both the location and shape of the distributions, making it a versatile goodness-of-fit test for continuous data
- When the null hypothesis is rejected, consider alternative distributions or models that may better describe the observed data
Limitations of Goodness-of-Fit Tests
Sample Size and Power Considerations
- The power of goodness-of-fit tests increases with sample size, meaning that even small deviations from the hypothesized distribution may be detected as statistically significant when the sample size is large
- Conversely, small sample sizes may lack the power to detect meaningful differences between the observed data and the hypothesized distribution, leading to a failure to reject the null hypothesis even when the fit is poor
- Consider the effect of sample size when interpreting the results and drawing conclusions
Binning and Ties in Data
- For the chi-square goodness-of-fit test, the choice of binning (the number and width of categories) can influence the test results
- If the bins are too narrow, the expected frequencies may be too small, violating the assumption of a minimum expected frequency of 5 in each category
- If the bins are too wide, the test may fail to detect deviations from the hypothesized distribution within the bins
- The K-S test is sensitive to ties in the data, which can occur when there are multiple observations with the same value
- Ties can affect the calculation of the test statistic and the critical values
- Consider the presence of ties when applying the K-S test and interpreting the results
Interpreting Rejected Null Hypotheses
- Goodness-of-fit tests do not provide information about the specific nature of the deviation from the hypothesized distribution or the underlying reasons for the lack of fit
- When a goodness-of-fit test rejects the null hypothesis, consider alternative distributions or models that may better describe the observed data
- Investigate the practical implications of the lack of fit and explore potential explanations for the discrepancy between the observed data and the hypothesized distribution