Polynomial regression takes linear regression to the next level, modeling complex relationships between variables as curved lines. It's a powerful tool for engineers dealing with nonlinear data that simple straight lines can't capture.
This method shines in engineering applications, from predicting material behavior to optimizing machine performance. By fitting curves to data, polynomial regression helps make better predictions and decisions in various engineering fields.
Polynomial Regression in Engineering
Concept and Applications
Top images from around the web for Concept and Applications
On curve fitting using R - Dave Tang's blog View original
Is this image relevant?
On curve fitting using R - Dave Tang's blog View original
Is this image relevant?
On curve fitting using R - Dave Tang's blog View original
Is this image relevant?
1 of 3
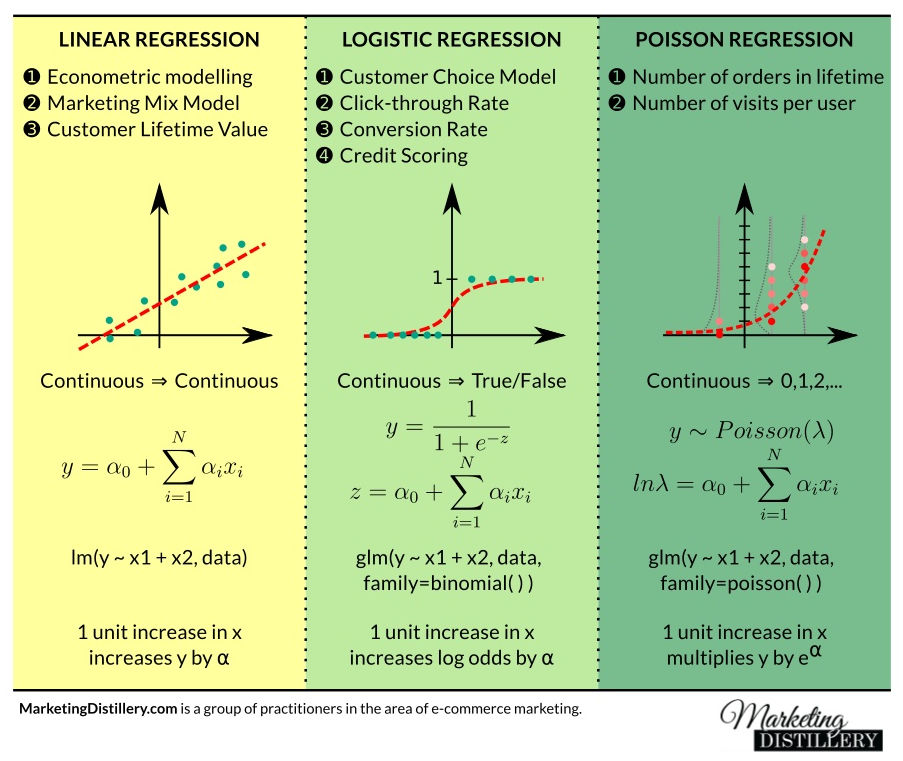
Polynomial regression models the relationship between independent and dependent variables as an nth degree polynomial function
Used when the relationship between variables is nonlinear and cannot be adequately captured by a simple linear regression model
Applied in engineering contexts to model complex relationships
Behavior of materials under different conditions
Performance of machines or systems
Optimization of processes
Employed for , data interpolation, and extrapolation in various engineering domains (mechanical, electrical, chemical, civil engineering)
Advantages and Uses
Captures nonlinear patterns that cannot be adequately represented by a simple linear model
Models complex behaviors in engineering systems
Performance of a machine under varying operating conditions
Efficiency of a process at different parameter settings
Response of a material to different stress levels
Provides more accurate predictions and better fits the observed data compared to linear regression models
Aids in optimizing engineering designs, controlling processes, and making data-driven decisions
Polynomial Model Degree Selection
Factors Influencing Degree Choice
The degree determines the complexity and flexibility of the regression curve
Higher degree allows for more complex relationships but may lead to overfitting
Choice depends on the nature of the data and underlying physical or engineering principles governing the relationship between variables
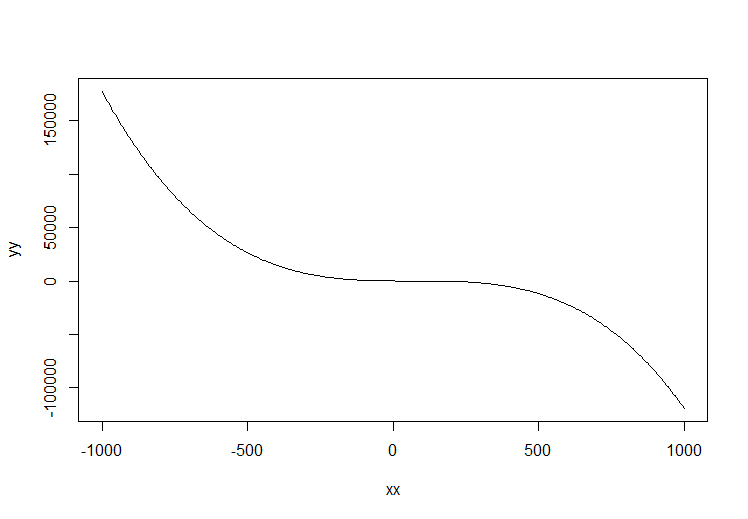
Visual inspection of data points plotted on a scatter plot provides an initial indication of appropriate degree
Clear curvature or multiple bends suggest a higher degree polynomial may be necessary
Domain knowledge and understanding of the engineering system being modeled can guide the selection
Some relationships may have known theoretical foundations suggesting a specific degree
Model Selection Techniques
Principle of parsimony (Occam's razor) suggests choosing the simplest model that adequately fits the data
Select the lowest degree polynomial that captures essential features without overfitting
techniques (k-fold cross-validation) assess performance of polynomial models with different degrees
Helps select the optimal degree balancing fit and generalization
Consider the range and distribution of independent variables to ensure the model is not extrapolating beyond observed data
Validate polynomial regression models using appropriate techniques
Cross-validation or holdout validation assess performance on unseen data and guard against overfitting
Coefficient Interpretation in Polynomial Regression
Understanding Coefficients
Coefficients represent weights assigned to each term of the polynomial function
Interpretation depends on the degree of the polynomial and scale of the variables
Constant term (intercept) represents the predicted value of the dependent variable when all independent variables are zero
Coefficient of the linear term indicates the change in the dependent variable for a one-unit increase in the independent variable, assuming all other terms are held constant
Coefficients of higher-order terms (quadratic, cubic) represent the impact of corresponding powers of the independent variable on the dependent variable
Capture nonlinear effects in the relationship
Assessing Coefficient Significance
Significance of coefficients assessed using hypothesis testing and p-values
Low p-value (typically < 0.05) suggests coefficient is statistically significant and has a meaningful impact on the dependent variable
Magnitude and sign of coefficients provide insights into direction and strength of the relationship
Positive coefficients indicate a positive relationship
Negative coefficients indicate an inverse relationship
Choice of polynomial degree and inclusion of based on domain knowledge, statistical significance, and model performance metrics (mean squared error, )
Polynomial Regression for Nonlinear Relationships
Capturing Nonlinearity
Particularly useful when the relationship between variables exhibits a nonlinear pattern
Captures complex behaviors in engineering systems
Performance of a machine under varying operating conditions
Efficiency of a process at different parameter settings
Response of a material to different stress levels
Provides more accurate predictions and better fits the observed data compared to linear regression models
Application and Considerations
Improved predictive accuracy aids in optimizing engineering designs, controlling processes, and making data-driven decisions
Consider the range and distribution of independent variables to ensure the model is not extrapolating beyond observed data
Validate polynomial regression models using appropriate techniques
Cross-validation or holdout validation assess performance on unseen data and guard against overfitting
Choice of polynomial degree and inclusion of interaction terms based on domain knowledge, statistical significance, and model performance metrics (mean squared error, R-squared)
Key Terms to Review (17)
Adjusted R-squared: Adjusted R-squared is a modified version of the R-squared statistic that adjusts for the number of predictors in a regression model. This statistic provides a more accurate measure of the goodness-of-fit for models with multiple predictors or complex relationships, as it penalizes excessive use of unhelpful predictors, making it particularly useful in multiple linear regression and polynomial regression analyses.
AIC - Akaike Information Criterion: The Akaike Information Criterion (AIC) is a measure used to compare the relative quality of statistical models for a given dataset. It helps in model selection by balancing model fit with complexity, penalizing models that are overly complex to prevent overfitting. A lower AIC value indicates a better-fitting model, making it useful for determining the optimal degree of polynomial regression among competing models.
Cross-validation: Cross-validation is a statistical method used to estimate the skill of a model on unseen data by partitioning the original dataset into subsets. This technique helps in assessing how the results of a statistical analysis will generalize to an independent dataset, allowing for better model selection and tuning. It is particularly valuable in scenarios like polynomial regression and multiple linear regression, where overfitting can occur, as well as in time series analysis with ARIMA models and nonparametric methods, where flexibility is essential.
Cubic regression: Cubic regression is a type of polynomial regression that uses a third-degree polynomial to model the relationship between the independent variable and the dependent variable. This approach allows for the creation of a curve that can capture more complex patterns in data compared to linear or quadratic models. By introducing a cubic term, it can represent inflection points where the direction of the curve changes, making it particularly useful for datasets that show non-linear relationships.
Curve Fitting: Curve fitting is the process of constructing a curve or mathematical function that best fits a series of data points. This technique is crucial in analyzing relationships between variables, particularly in material science where it helps to model the behavior of materials under various conditions. By employing different types of functions, such as polynomial functions, researchers can interpret data more effectively and make predictions about material properties.
Degree of polynomial: The degree of a polynomial is the highest power of the variable in the polynomial expression. This concept is crucial in understanding the behavior of polynomial functions, including their shape, end behavior, and how they can fit data points in regression analysis. The degree also plays a key role in determining the number of roots or solutions a polynomial can have.
Fitting a Curve: Fitting a curve involves finding a mathematical function that best represents the relationship between variables in a dataset. This process allows for analyzing trends, making predictions, and understanding the underlying patterns of data. The choice of the type of curve, such as linear or polynomial, is crucial as it directly affects how well the function models the data points.
Interaction Terms: Interaction terms are variables in a statistical model that capture the combined effect of two or more predictors on a response variable, highlighting how the relationship between predictors can change when considered together. They allow for the exploration of more complex relationships that may not be evident when analyzing each predictor individually, thus enhancing the model's ability to explain variability in the response.
Least Squares Method: The least squares method is a statistical technique used to find the best-fitting curve or line for a given set of data points by minimizing the sum of the squares of the vertical distances (residuals) between the observed values and the values predicted by the model. This method is crucial in regression analysis, especially for polynomial regression, as it allows for more complex relationships between variables to be captured effectively.
Non-linear relationships: Non-linear relationships refer to connections between variables that do not follow a straight line when graphed. This means that as one variable changes, the other does not change in a consistent or proportional manner, resulting in curves or bends in the plotted data. Non-linear relationships are important because they often provide a more accurate representation of real-world scenarios where interactions are complex and not simply additive.
Python with scikit-learn: Python with scikit-learn refers to the use of the Python programming language in combination with the scikit-learn library, which provides a wide range of tools for data analysis and machine learning. This powerful combination enables users to implement various statistical methods, including polynomial regression, to model complex relationships within data sets. By utilizing Python's syntax and the functionalities of scikit-learn, practitioners can effectively build, evaluate, and deploy predictive models.
Quadratic regression: Quadratic regression is a type of polynomial regression that specifically models the relationship between a dependent variable and an independent variable using a second-degree polynomial equation. This means that the regression equation takes the form of $$y = ax^2 + bx + c$$, where 'a', 'b', and 'c' are constants. This method is particularly useful for fitting data that exhibits a parabolic trend, allowing for the analysis of situations where increases or decreases in the independent variable lead to non-linear responses in the dependent variable.
R programming: R programming is a language and environment designed for statistical computing and data analysis. It offers a wide range of statistical techniques and graphical tools, making it an essential tool for data scientists and statisticians. R is particularly powerful in handling complex data structures, fitting models such as polynomial regression, analyzing failure time distributions, conducting factor analysis, and performing rank-based tests.
R-squared: R-squared, also known as the coefficient of determination, is a statistical measure that represents the proportion of variance for a dependent variable that's explained by an independent variable or variables in a regression model. This value ranges from 0 to 1, where 0 indicates that the independent variables do not explain any of the variability in the dependent variable, while 1 indicates that they explain all the variability. The significance of r-squared varies across different types of regression models, reflecting how well the chosen model fits the data.
Regularization techniques: Regularization techniques are methods used in statistical modeling to prevent overfitting by adding a penalty term to the loss function. These techniques help control the complexity of the model, promoting simpler models that generalize better to unseen data, especially when dealing with polynomial regression. By discouraging overly complex models, regularization ensures that the model does not fit noise in the training data.
Residual Analysis: Residual analysis involves examining the differences between observed values and the values predicted by a statistical model. This process helps identify patterns in the residuals, which can indicate whether the model is appropriate for the data. Analyzing these differences is crucial in assessing the fit of a model, as well as in identifying any potential issues such as non-linearity or heteroscedasticity.
Stress-strain analysis: Stress-strain analysis is a method used to determine the relationship between the stress applied to a material and the resulting strain it experiences. This analysis is crucial for understanding how materials deform under various loads, allowing engineers to predict failure points and design structures that can withstand specific forces. It helps in characterizing material behavior, particularly in elastic and plastic regions, which is essential for ensuring safety and reliability in engineering applications.