Process capability analysis is a key tool in quality control. It helps determine if a process can consistently meet customer requirements by producing output within specified limits. This analysis uses indices like Cp and Cpk to measure potential and actual process capability.
Understanding these indices is crucial for improving manufacturing processes. They show how well a process performs compared to its specifications. By calculating and interpreting Cp and Cpk, engineers can identify areas for improvement and estimate the likelihood of producing nonconforming items.
Process Capability Indices
Assessing Process Capability
- Process capability analysis is a statistical method used to determine if a process can consistently produce output that meets customer requirements or specifications
- Process capability indices, such as Cp and Cpk, quantify the capability of a process relative to the specification limits
- The process capability index Cp measures the potential capability of a process, assuming the process mean is centered between the specification limits
- Cp is calculated as , where USL is the upper specification limit, LSL is the lower specification limit, and σ is the process standard deviation
- The process capability index Cpk measures the actual capability of a process, taking into account the process mean's proximity to the specification limits
- Cpk is calculated as , where μ is the process mean
- A process is considered capable if the Cp and Cpk values are greater than or equal to 1.33, indicating that the process can produce output within the specification limits with a high degree of consistency (Six Sigma level)
Calculating Process Capability Indices
- To calculate Cp, first determine the upper specification limit (USL), lower specification limit (LSL), and process standard deviation (σ)
- For example, if USL = 10, LSL = 6, and σ = 0.5, then
- To calculate Cpk, additionally determine the process mean (μ)
- Using the same example, if μ = 8, then
- Compare the calculated Cp and Cpk values to the benchmark value of 1.33 to assess the process capability
- If both Cp and Cpk are greater than or equal to 1.33, the process is considered capable (manufacturing processes)
- If either Cp or Cpk is less than 1.33, the process may require improvement to consistently meet specifications (service processes)
Interpreting Capability Indices
Understanding Cp and Cpk Values
- Process capability indices provide insights into a process's ability to consistently produce conforming products
- A Cp value greater than 1 indicates that the process spread (6σ) is smaller than the specification width (USL - LSL), suggesting that the process has the potential to produce conforming products if the process mean is centered
- For example, if Cp = 1.5, the process spread is 1.5 times smaller than the specification width
- A Cpk value greater than 1 indicates that the process is capable of consistently producing conforming products, as the process mean is sufficiently far from the specification limits
- For instance, if Cpk = 1.33, the process mean is at least 4 standard deviations away from the nearest specification limit
- Cpk values less than 1 indicate that the process is not capable of consistently producing conforming products, as the process mean is too close to or outside the specification limits
- If Cpk = 0.8, the process mean is only 2.4 standard deviations away from the nearest specification limit, increasing the likelihood of nonconforming items
Relating Capability Indices to Process Performance
- The larger the Cp and Cpk values, the more capable the process is of producing conforming products with minimal variation
- A process with Cp = 2 and Cpk = 1.5 is more capable than a process with Cp = 1.33 and Cpk = 1.33
- Cp and Cpk values can be related to the expected proportion of nonconforming items produced by the process
- A process with Cpk = 1.33 is expected to produce no more than 63 nonconforming parts per million (ppm) opportunities
- A process with Cpk = 1.67 is expected to produce no more than 0.6 nonconforming ppm (Six Sigma level)
- Monitoring Cp and Cpk values over time can help track process performance and identify trends or changes in capability
- A decreasing trend in Cpk values may indicate a need for process improvement or maintenance
Nonconforming Items Estimation
Using Z-Scores and Standard Normal Distribution
- Process capability analysis can estimate the proportion of nonconforming items produced by a process, assuming a normally distributed process
- The Z-score represents the number of standard deviations between the process mean and the specification limit
- Z-score for the upper specification limit is calculated as
- Z-score for the lower specification limit is calculated as
- The area under the standard normal distribution curve beyond the Z-score represents the proportion of nonconforming items
- For example, if Z = 3 for the upper specification limit, the area beyond Z = 3 is 0.00135, indicating that 0.135% of items are expected to exceed the USL
Estimating Nonconforming Items for Capable Processes
- For a capable process (Cpk ≥ 1.33), the expected proportion of nonconforming items is less than 0.0063% (63 parts per million)
- This corresponds to a Z-score of 3 or more for both the upper and lower specification limits
- Processes with higher Cpk values have even lower expected proportions of nonconforming items
- A process with Cpk = 1.67 (Six Sigma level) has an expected nonconforming proportion of 0.00000057% (0.57 parts per billion)
- Estimating the proportion of nonconforming items helps set realistic quality goals and assess the process's ability to meet customer requirements
- If the estimated proportion of nonconforming items is higher than the customer's acceptable quality level (AQL), process improvement may be necessary
Process Improvement Opportunities
Identifying Areas for Improvement
- Process capability analysis helps identify opportunities for process improvement by revealing the process's current performance relative to customer requirements or specifications
- If the process capability indices (Cp and Cpk) are less than 1.33, the process may require improvement to reduce variation and ensure consistent production of conforming products
- For example, if Cp = 1.2 and Cpk = 0.9, the process has potential capability but is not centered, resulting in a higher proportion of nonconforming items
- Investigating the causes of variation, such as common cause and special cause variation, can help identify specific areas for improvement
- Common cause variation is inherent to the process and can be reduced through process optimization and standardization
- Special cause variation arises from external factors and can be eliminated by identifying and addressing the root causes (operator errors, material inconsistencies, equipment malfunctions)
Implementing Process Improvement Strategies
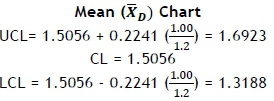
- Opportunities for process improvement may include reducing common cause variation through the implementation of statistical process control (SPC) techniques, such as control charts and process optimization
- Control charts help monitor the process and detect any unusual variations or trends
- Process optimization involves adjusting process parameters to minimize variation and improve performance
- Centering the process mean between the specification limits can improve the Cpk value and reduce the proportion of nonconforming items
- This can be achieved by adjusting the process settings or implementing process control systems
- Continuously monitoring process capability indices and implementing improvement initiatives can help maintain and enhance the process's ability to consistently meet customer requirements
- Regularly reviewing process data, conducting capability studies, and engaging in continuous improvement activities (Lean Six Sigma) ensure ongoing process performance
- Collaborating with cross-functional teams, including quality assurance, production, and engineering, can provide diverse perspectives and expertise for process improvement efforts
- Involving operators and front-line staff in improvement initiatives can also lead to more effective and sustainable solutions