t-SNE and UMAP are powerful tools for visualizing high-dimensional data in lower dimensions. These non-linear techniques preserve local structure, making them great for revealing hidden patterns and relationships that linear methods like PCA might miss.
Understanding how to apply and tune t-SNE and UMAP is crucial for effective data visualization. By adjusting key parameters like perplexity and n_neighbors, you can balance local and global structure preservation, tailoring the output to your specific dataset and analysis goals.
Non-linear Dimensionality Reduction
Overview of t-SNE and UMAP
- t-SNE (t-Distributed Stochastic Neighbor Embedding) and UMAP (Uniform Manifold Approximation and Projection) are non-linear dimensionality reduction techniques used for visualizing high-dimensional data in lower-dimensional spaces (typically 2D or 3D)
- Both t-SNE and UMAP aim to preserve the local structure of the high-dimensional data in the low-dimensional representation
- Similar data points in the original space should remain close together in the reduced space
- Dissimilar data points should be further apart in the reduced space
Key Concepts and Algorithms
- t-SNE converts the high-dimensional Euclidean distances between data points into conditional probabilities that represent similarities
- Minimizes the Kullback-Leibler divergence between the joint probabilities of the low-dimensional embedding and the high-dimensional data
- The t-distribution is used to compute the similarity between two points in the low-dimensional space, allowing for a higher probability of dissimilar points being further apart
- UMAP constructs a weighted k-neighbor graph in the high-dimensional space and then optimizes a low-dimensional graph to be as structurally similar as possible
- Optimization is based on cross-entropy between the two graphs
- Assumes that the data lies on a locally connected Riemannian manifold and uses a fuzzy topological structure to approximate the manifold
- Both t-SNE and UMAP have a non-convex optimization objective
- The resulting low-dimensional embeddings can vary across different runs
- Embeddings are sensitive to the initial random state
t-SNE vs UMAP vs PCA
Linearity and Non-linearity
- Principal Component Analysis (PCA) is a linear dimensionality reduction technique, while t-SNE and UMAP are non-linear techniques
- PCA finds a new set of orthogonal axes (principal components) that maximize the variance of the projected data
- Data is transformed linearly onto these axes in PCA
- t-SNE and UMAP do not rely on linear transformations and can capture more complex, non-linear relationships in the data
Global vs Local Structure Preservation
- PCA preserves the global structure of the data
- Low-dimensional representation maintains the relative distances between far apart points in the original space
- t-SNE and UMAP focus on preserving the local structure
- Often at the expense of the global structure
- Prioritize maintaining the relationships between nearby points in the original space
Deterministic vs Stochastic Results
- PCA is deterministic and has a unique solution for a given dataset
- t-SNE and UMAP are stochastic and can produce different results across runs due to their non-convex optimization
Suitable Data Characteristics and Use Cases
- PCA is better suited for datasets with linear relationships and Gaussian-distributed data
- t-SNE and UMAP are more appropriate for non-linear relationships and complex data distributions
- t-SNE and UMAP are primarily used for visualization purposes
- They do not provide a direct mapping from the high-dimensional space to the low-dimensional space
- Difficult to embed new, unseen data points
- PCA can be used for both visualization and as a pre-processing step for other machine learning tasks
Applying t-SNE and UMAP
Input Data and Preprocessing
- The input to t-SNE and UMAP is typically a high-dimensional feature matrix
- Each row represents a data point
- Each column represents a feature or dimension
- Before applying t-SNE or UMAP, it is essential to preprocess the data by scaling the features to a consistent range
- Use standardization or min-max scaling to ensure that the distance calculations are not dominated by features with larger magnitudes
Output and Visualization
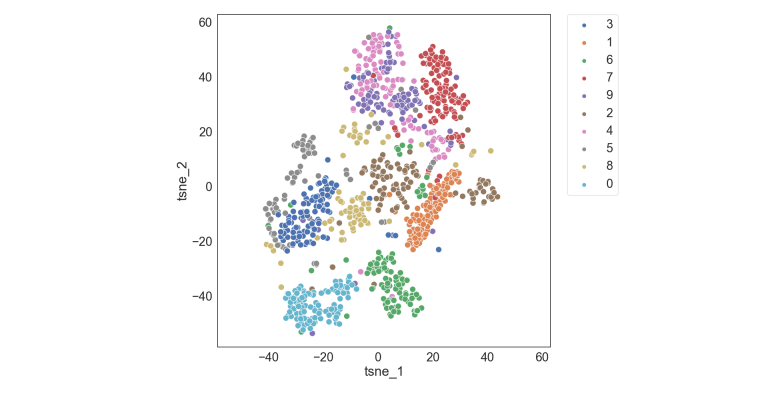
- The output of t-SNE and UMAP is a low-dimensional embedding of the data points, usually in 2D or 3D
- Visualize using scatter plots or other visualization techniques
- Experiment with different hyperparameter settings to find the best representation of the data
- Perplexity for t-SNE
- n_neighbors and min_dist for UMAP
![Overview of t-SNE and UMAP, t-SNE in Python [single cell RNA-seq example and hyperparameter optimization] - Renesh Bedre](https://storage.googleapis.com/static.prod.fiveable.me/search-images%2F%22t-SNE_UMAP_overview_dimensionality_reduction_visualization_high-dimensional_data_local_structure_comparison_infographic%22-tsne_teaser.png.)
Applicability to Various Data Types
- t-SNE and UMAP can be applied to various types of high-dimensional data
- Images
- Text embeddings
- Gene expression data
- Gain insights into the underlying structure and relationships between data points
Comparison with Other Techniques
- Compare the results of t-SNE and UMAP with other dimensionality reduction techniques (PCA)
- Assess the quality and interpretability of the low-dimensional representations
- Evaluate the preservation of important patterns and structures in the data
Tuning t-SNE and UMAP Hyperparameters
t-SNE Hyperparameters
- Perplexity balances the attention between local and global aspects of the data
- Higher values (30-50) result in more global structure
- Lower values (5-10) emphasize local structure
- Learning_rate determines the speed of the optimization process
- Higher values lead to faster convergence but potentially less stable results
UMAP Hyperparameters
- n_neighbors controls the trade-off between local and global structure
- Higher values capture more global structure
- Lower values focus on local neighborhoods
- min_dist determines the minimum distance between points in the low-dimensional space, affecting the compactness of the clusters
- Smaller values lead to tighter clusters
- Larger values produce more dispersed clusters
- n_components specifies the number of dimensions in the low-dimensional embedding (typically set to 2 or 3 for visualization purposes)
Hyperparameter Tuning Strategies
- Use a grid search or random search approach to tune the hyperparameters
- Evaluate the quality of the visualizations based on domain knowledge and visual inspection
- Optimal hyperparameter settings may vary depending on the characteristics of the dataset
- Size
- Dimensionality
- Presence of noise or outliers
- Assess the stability and reproducibility of the visualizations
- Run the algorithms multiple times with different random seeds
- Compare the results
Computational Considerations
- Consider the computational complexity of t-SNE and UMAP when tuning hyperparameters
- Larger datasets and higher perplexity or n_neighbors values can significantly increase the runtime of the algorithms
- Balance the quality of the visualizations with the computational resources available