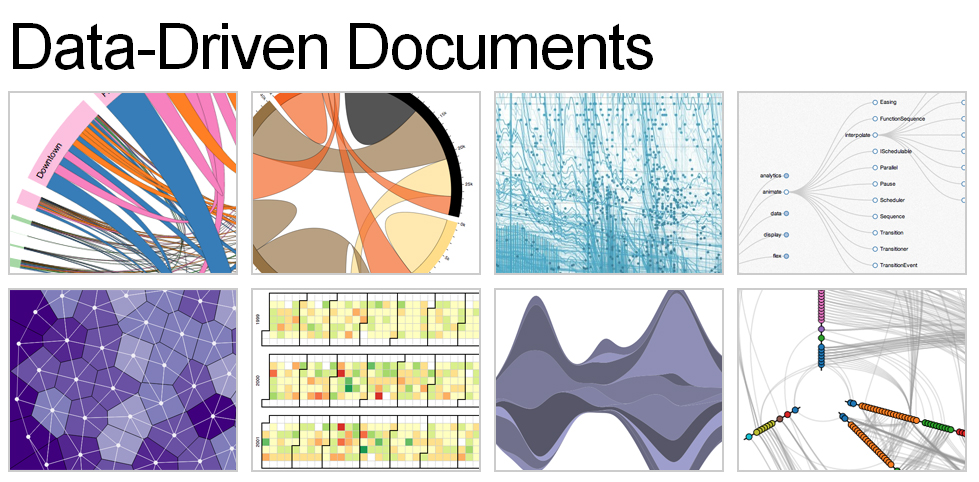
is a powerful tool for creating -based visualizations on the web. It lets you bind data to visual elements, manipulate them dynamically, and add smooth transitions and animations to bring your charts to life.

From bar charts to scatterplots, D3.js offers versatile options for visualizing data. You can style elements, apply color scales, and use advanced techniques like gradients to create visually striking and informative graphics that adapt to different screen sizes.

SVG Visualization with D3.js

Creating SVG-based Visualizations

Top images from around the web for Creating SVG-based Visualizations
  • D3.js (Data-Driven Documents) is a JavaScript library for creating interactive and dynamic data visualizations in web browsers using SVG, HTML, and CSS
  • SVG (Scalable Vector Graphics) is an XML-based markup language for describing two-dimensional vector graphics, which can be used to create various types of visualizations
  • D3.js provides a selection mechanism for selecting and manipulating SVG elements, allowing you to bind data to visual elements and update them dynamically
  • Transitions and animations can be applied to SVG elements using D3.js to create smooth and engaging visual effects when data changes or user interactions occur (fading in/out, moving elements)

Types of SVG-based Visualizations

  • Bar charts represent data using rectangular bars, where the height or length of each bar corresponds to the value it represents (population by country, sales by category)
    • D3.js provides functions for creating and manipulating SVG rectangles to create bar charts
  • Line charts display data as a series of points connected by straight lines, showing trends or changes over time (stock prices, temperature variations)
    • D3.js allows you to create line charts by generating SVG paths based on data points
  • Scatterplots use dots or markers to represent individual data points in a two-dimensional space, where the position of each point is determined by its values for two variables (student test scores, product ratings)
    • D3.js enables the creation of scatterplots by mapping data to SVG circles or other shapes

Styling SVG Elements

Applying Styles and Attributes

  • D3.js allows you to set various attributes and styles on SVG elements to control their appearance, such as color, color, stroke width, opacity, and more
  • CSS (Cascading Style Sheets) can be used in conjunction with D3.js to style SVG elements by applying classes or inline styles to the elements
  • The
    attr()
    method in D3.js is used to set or modify attributes of SVG elements, such as
    width
    ,
    height
    ,
    x
    ,
    y
    ,
    rx
    ,
    ry
    , and more, depending on the specific element type
  • The
    style()
    method in D3.js allows you to set CSS properties on SVG elements, such as
    fill
    ,
    stroke
    ,
    stroke-width
    ,
    opacity
    ,
    font-size
    , and more

Advanced Styling Techniques

  • D3.js provides color scales, such as
    [d3.scaleOrdinal()](https://www.fiveableKeyTerm:d3.scaleOrdinal())
    and
    d3.scaleSequential()
    , which can be used to map data values to colors based on predefined color schemes or custom color ranges (categorical data, continuous data)
  • Gradients and patterns can be applied to SVG elements using D3.js to create visually appealing and informative visualizations
    • Gradients can be linear or radial, creating smooth color transitions (heat maps, choropleth maps)
    • Patterns can be created using SVG elements or external images (textures, icons)
  • Styling can be dynamically updated based on data or user interactions using D3.js, allowing for interactive and data-driven customization of the visualization's appearance (highlighting, )

Data Mapping with Scales and Axes

Scales in D3.js

  • Scales in D3.js are functions that map input domains (data values) to output ranges (visual properties), enabling the translation of data into visual representations
  • D3.js provides various types of scales, such as linear scales (
    [d3.scaleLinear()](https://www.fiveableKeyTerm:d3.scaleLinear())
    ), logarithmic scales (
    [d3.scaleLog()](https://www.fiveableKeyTerm:d3.scalelog())
    ), time scales (
    [d3.scaleTime()](https://www.fiveableKeyTerm:d3.scaletime())
    ), and ordinal scales (
    d3.scaleOrdinal()
    ), among others
  • Linear scales are commonly used for continuous quantitative data, mapping a continuous input domain to a continuous output range (height of bars, position of points)
    • They are created using
      d3.scaleLinear()
      and can be configured with a domain and range
  • Logarithmic scales are used when the data has a wide range of values and needs to be displayed on a compressed scale (population sizes, financial data)
    • They are created using
      d3.scaleLog()
      and are useful for visualizing data with exponential growth or decay
  • Time scales (
    d3.scaleTime()
    ) are used to map temporal data, such as dates or timestamps, to positions on an axis (time series data, event timelines)
    • They handle the complexities of date and time formatting and intervals
  • Ordinal scales (
    d3.scaleOrdinal()
    ) are used for mapping discrete categorical data to visual properties, such as colors or positions (product categories, country names)
    • They assign a unique output value for each input value in the domain

Axes in D3.js

  • Axes in D3.js are visual representations of scales, providing a way to display tick marks, labels, and gridlines based on the scale's domain and range
  • D3.js provides functions like
    [d3.axisLeft()](https://www.fiveableKeyTerm:d3.axisLeft())
    ,
    [d3.axisBottom()](https://www.fiveableKeyTerm:d3.axisBottom())
    ,
    d3.axisRight()
    , and
    d3.axisTop()
    to create axes
  • Scales and axes can be customized using various methods and properties, such as setting the number of ticks, formatting tick labels, adjusting the tick size, and styling the axis lines and labels (date formatting, number formatting, axis orientation)

Responsive Visualizations

Creating Responsive SVG

  • Responsive visualizations adapt to different screen sizes and resolutions, ensuring that the visualization remains legible and effective across various devices and browsers
  • SVG elements can be made responsive by setting the
    width
    and
    height
    attributes to percentage values instead of fixed pixel values, allowing them to scale proportionally to the container's size
  • The
    [viewBox](https://www.fiveableKeyTerm:viewBox)
    attribute of the SVG element defines the coordinate system and aspect ratio of the SVG, enabling it to scale and maintain its proportions when the container size changes
  • CSS media queries can be used to apply different styles and layouts to the visualization based on the screen size or device type, allowing for customized presentations on different devices (mobile, tablet, desktop)

Adaptive Visualization Techniques

  • D3.js provides the
    d3.select(window).on("resize", ...)
    event listener to detect changes in the browser window size and trigger updates to the visualization accordingly
  • Responsive designs often involve adjusting the layout, font sizes, and other visual properties of the visualization to ensure readability and usability on smaller screens or different device orientations
  • Adaptive visualizations go beyond simple scaling and may involve modifying the visual encoding, data granularity, or interaction techniques based on the available screen space and user context
  • Techniques such as data aggregation, filtering, or progressive disclosure can be employed to present meaningful information within the constraints of smaller screens or limited interaction capabilities (collapsible sections, simplified charts)
  • Testing the visualization on various devices and screen sizes is crucial to ensure its responsiveness and adaptability across different environments

Key Terms to Review (25)

Append(): The `append()` function in D3.js is used to create new elements and attach them to the selected DOM elements. This method allows developers to dynamically generate SVG shapes, text, or any other elements, making it a fundamental tool for building interactive and data-driven visualizations. By using `append()`, you can seamlessly incorporate data into the document structure, enabling the creation of complex visual representations based on datasets.
Bar chart: A bar chart is a visual representation of categorical data using rectangular bars to show the quantity or frequency of each category. It allows for easy comparison between different categories, making it a fundamental tool for summarizing and analyzing data in various contexts.
Csv: CSV, or Comma-Separated Values, is a file format that stores tabular data in plain text, where each line represents a data record and each record consists of fields separated by commas. This simple format allows for easy data exchange between different applications, making it widely used for data import and export across various platforms, including data visualization tools and databases.
D3.axisBottom(): d3.axisBottom() is a function in D3.js used to create a bottom-oriented axis for visualizations, typically along the x-axis. This function generates the ticks and labels needed to represent quantitative data, allowing for clear and effective communication of information on an SVG-based visualization. It works hand-in-hand with scales and allows for customization in terms of tick formatting and positioning.
D3.axisLeft(): d3.axisLeft() is a method in D3.js that creates a left-oriented axis for visualizations, particularly in SVG-based charts. It is commonly used to define and render the y-axis of a graph, allowing for better data representation and readability. This method is highly customizable, enabling the addition of ticks, labels, and styling to enhance the visual clarity of the data displayed.
D3.js: d3.js is a JavaScript library designed for producing dynamic, interactive data visualizations in web browsers. It leverages the full capabilities of modern web standards such as HTML, SVG, and CSS, allowing developers to bind data to DOM elements and apply data-driven transformations to the document. With d3.js, users can create complex visual representations like heatmaps, graphs, and maps that respond to user interactions.
D3.scaleLinear(): d3.scaleLinear() is a function in the D3.js library that creates a linear scale, which maps input domain values to output range values in a continuous manner. This is particularly useful for visualizing data in graphs and charts, as it helps in converting raw data into a format that can be easily represented visually. By establishing a relationship between data values and visual representations, this function supports effective data binding and manipulation in SVG-based visualizations.
D3.scalelog(): d3.scalelog() is a function in D3.js that creates a logarithmic scale, which is used to map data values to a visual representation in SVG-based visualizations. This type of scale is particularly useful when dealing with data that spans several orders of magnitude, as it allows for better visualization of smaller values alongside larger ones. The logarithmic scale compresses large ranges of data and enhances the understanding of relationships between values.
D3.scaleOrdinal(): d3.scaleOrdinal() is a function in D3.js that creates an ordinal scale, which maps a discrete set of input values to a corresponding discrete set of output values. This scale is particularly useful for visualizations that require assigning unique colors, shapes, or other attributes to distinct categories, enhancing data representation in SVG-based visualizations and enabling effective data binding through D3.js.
D3.scaletime(): d3.scaletime() is a D3.js function that creates a time scale, mapping dates and times to a numerical range suitable for visualizations. This function helps in effectively visualizing temporal data by allowing developers to scale time values linearly or logarithmically. It is essential for creating time-based charts, enabling smooth transitions and accurate representation of time intervals in SVG-based visualizations.
Data joins: Data joins are operations that combine data from multiple sources into a single dataset based on common fields. This concept is crucial in data visualization as it allows for the integration of different datasets, enabling more comprehensive analysis and richer visual representations. By connecting various data points, data joins enhance the ability to tell a cohesive story through visualizations.
Ease: Ease refers to the simplicity and comfort with which users can interact with visual elements, making the data easier to understand and interpret. In the context of creating visualizations using SVG and D3.js, ease emphasizes the importance of user-friendly designs that enhance the overall experience while reducing cognitive load. A focus on ease ensures that visualizations are accessible to a wider audience, allowing users to grasp complex data without unnecessary complications.
Enter-update-exit pattern: The enter-update-exit pattern is a fundamental approach in data visualization, especially in libraries like D3.js, for managing data binding to visual elements. It allows developers to efficiently handle the lifecycle of elements based on data changes by distinguishing between new data, existing data, and data that has been removed. This pattern enhances interactivity and ensures that visualizations accurately represent the underlying data at all times.
Fill: In the context of D3.js and SVG-based visualizations, 'fill' refers to the property that determines the color or pattern used to fill the interior of shapes like rectangles, circles, and paths. This property is crucial for visually distinguishing different elements in a visualization, enhancing both aesthetics and clarity. By manipulating the 'fill' attribute, developers can convey data-driven insights through color coding, allowing viewers to interpret information more effectively.
Interactivity: Interactivity refers to the ability of users to engage with a visualization or data representation in a dynamic way, allowing them to manipulate data and explore information more effectively. This engagement can enhance understanding and retention by enabling users to customize their experience, such as filtering data, drilling down for details, or triggering animations. Effective interactivity fosters exploration, supports decision-making, and encourages deeper insights from the data presented.
JSON: JSON, which stands for JavaScript Object Notation, is a lightweight data interchange format that is easy for humans to read and write, and easy for machines to parse and generate. It is primarily used to transmit data between a server and web application as text. In the context of creating SVG-based visualizations with D3.js, JSON serves as an efficient way to store and structure the data that is visualized, allowing for dynamic updates and manipulation of graphics based on changing data sets.
Legends: Legends are visual aids used in data visualization to explain the symbols, colors, and patterns used in charts and graphs. They provide clarity by linking visual elements to their corresponding data categories or values, making it easier for viewers to interpret complex information. In the context of SVG-based visualizations created with D3.js, legends are crucial for ensuring that users can understand the meaning behind different shapes and colors presented in a visualization.
Scalability: Scalability refers to the capability of a system or process to handle a growing amount of work or its potential to accommodate growth. In data visualization, scalability is crucial because it ensures that visual representations can maintain performance and clarity as data size increases, allowing users to extract insights effectively regardless of the dataset's complexity or volume.
Scatterplot: A scatterplot is a type of data visualization that displays values for typically two variables for a set of data using dots. Each dot represents an observation, and its position on the horizontal and vertical axes indicates the values of the two variables. This visualization helps to identify relationships, trends, and patterns between the variables, making it a fundamental tool in data analysis.
Select(): The `select()` function in D3.js is used to select elements from the DOM, enabling developers to manipulate and bind data to those elements. This function allows you to target specific SVG elements, such as circles, rectangles, and paths, making it crucial for creating interactive visualizations. By selecting elements, you can apply styles, attributes, and data binding, which is essential for dynamic and responsive visualizations.
Stroke: In the context of data visualization and SVG graphics, a stroke refers to the outline or border of a shape or path. This property is important as it determines the color, width, and style of the line that defines the shape's edges, significantly impacting the overall appearance and clarity of visualizations created using D3.js.
SVG: SVG stands for Scalable Vector Graphics, which is an XML-based format for rendering two-dimensional vector images. SVG allows for the creation of graphics that are resolution-independent, meaning they can be scaled to any size without losing quality. This flexibility makes SVG particularly useful for interactive visualizations and dynamic web applications, as well as being easily manipulated with CSS and JavaScript.
Tooltips: Tooltips are interactive UI elements that display additional information when a user hovers over or clicks on a data point in a visualization. They enhance user experience by providing context and details without cluttering the visual space, allowing for better interpretation of complex data sets.
Transition: In data visualization, a transition refers to the smooth change from one state to another, helping to convey information more effectively and engagingly. Transitions are crucial in making visual changes clear and understandable to the viewer, allowing for better comprehension of the data being presented. They help illustrate how data evolves over time or in response to user interactions.
ViewBox: The viewBox is an important attribute in SVG (Scalable Vector Graphics) that defines the position and dimension of a viewport for the SVG content. It allows for responsive designs by specifying how the coordinate system of the SVG is mapped to the actual display area, enabling scaling and positioning of graphics effectively. This attribute is particularly useful when creating visualizations with D3.js, as it ensures that elements scale appropriately regardless of the screen size or resolution.
© 2024 Fiveable Inc. All rights reserved.
AP® and SAT® are trademarks registered by the College Board, which is not affiliated with, and does not endorse this website.