Virtual and augmented reality are revolutionizing data visualization. These technologies create immersive, 3D environments that let users explore complex data in new ways. By tapping into our natural spatial awareness, VR and AR make it easier to spot patterns and relationships that might be missed in traditional 2D charts.
While VR and AR offer exciting possibilities, they also come with challenges. Hardware limitations, accessibility issues, and potential motion sickness can hinder adoption. Still, as the tech improves, these immersive visualizations have the potential to transform how we understand and interact with data across many fields.
Applications of VR and AR in Data Visualization
Enhancing User Engagement and Understanding
- VR and AR technologies offer new ways to present and interact with data visualizations, enabling users to explore data in immersive, three-dimensional environments
- Provides a more intuitive and natural way to navigate and manipulate data visualizations
- Allows users to identify patterns, relationships, and insights that may not be apparent in traditional 2D visualizations (scatter plots, bar charts)
- The immersive nature of VR and AR helps users better understand complex, high-dimensional data by providing a more intuitive sense of scale, depth, and spatial relationships
- Enables users to visualize and interact with data in a way that more closely resembles real-world experiences
- Facilitates a deeper understanding of the relationships between data points and variables (3D scatter plots, network diagrams)
Potential Applications Across Industries
- VR and AR have potential applications in various fields, including:
- Scientific research: Visualizing complex scientific data (molecular structures, astronomical data)
- Education: Creating interactive learning experiences (historical simulations, virtual field trips)
- Training simulations: Providing realistic training scenarios (flight simulators, surgical training)
- Urban planning: Visualizing and manipulating 3D models of cities and infrastructure (traffic flow, building designs)
- Decision-making in industries such as healthcare, finance, and manufacturing (patient data, financial market trends, factory layouts)
- VR and AR facilitate collaborative data analysis by allowing multiple users to interact with the same visualization simultaneously, regardless of their physical location
- Enables remote teams to work together on data analysis and decision-making
- Promotes knowledge sharing and collaborative problem-solving (virtual meeting rooms, shared AR workspaces)
Immersive Data Visualization Design
Leveraging Human Perception and Cognition
- Designing effective VR and AR data visualizations requires a deep understanding of human perception, cognition, and interaction principles to create intuitive and engaging user experiences
- Considers factors such as depth perception, spatial awareness, and attention allocation
- Applies principles of visual hierarchy, color theory, and gestalt psychology to guide user attention and understanding (visual cues, contrast, grouping)
- VR data visualizations should leverage the full 3D space, allowing users to explore data from multiple angles and perspectives, while providing clear visual cues and reference points for navigation and orientation
- Utilizes the immersive environment to create a sense of presence and engagement
- Incorporates wayfinding techniques and spatial landmarks to help users maintain their bearings (grids, axes, labels)
Integrating with Real-World Environments
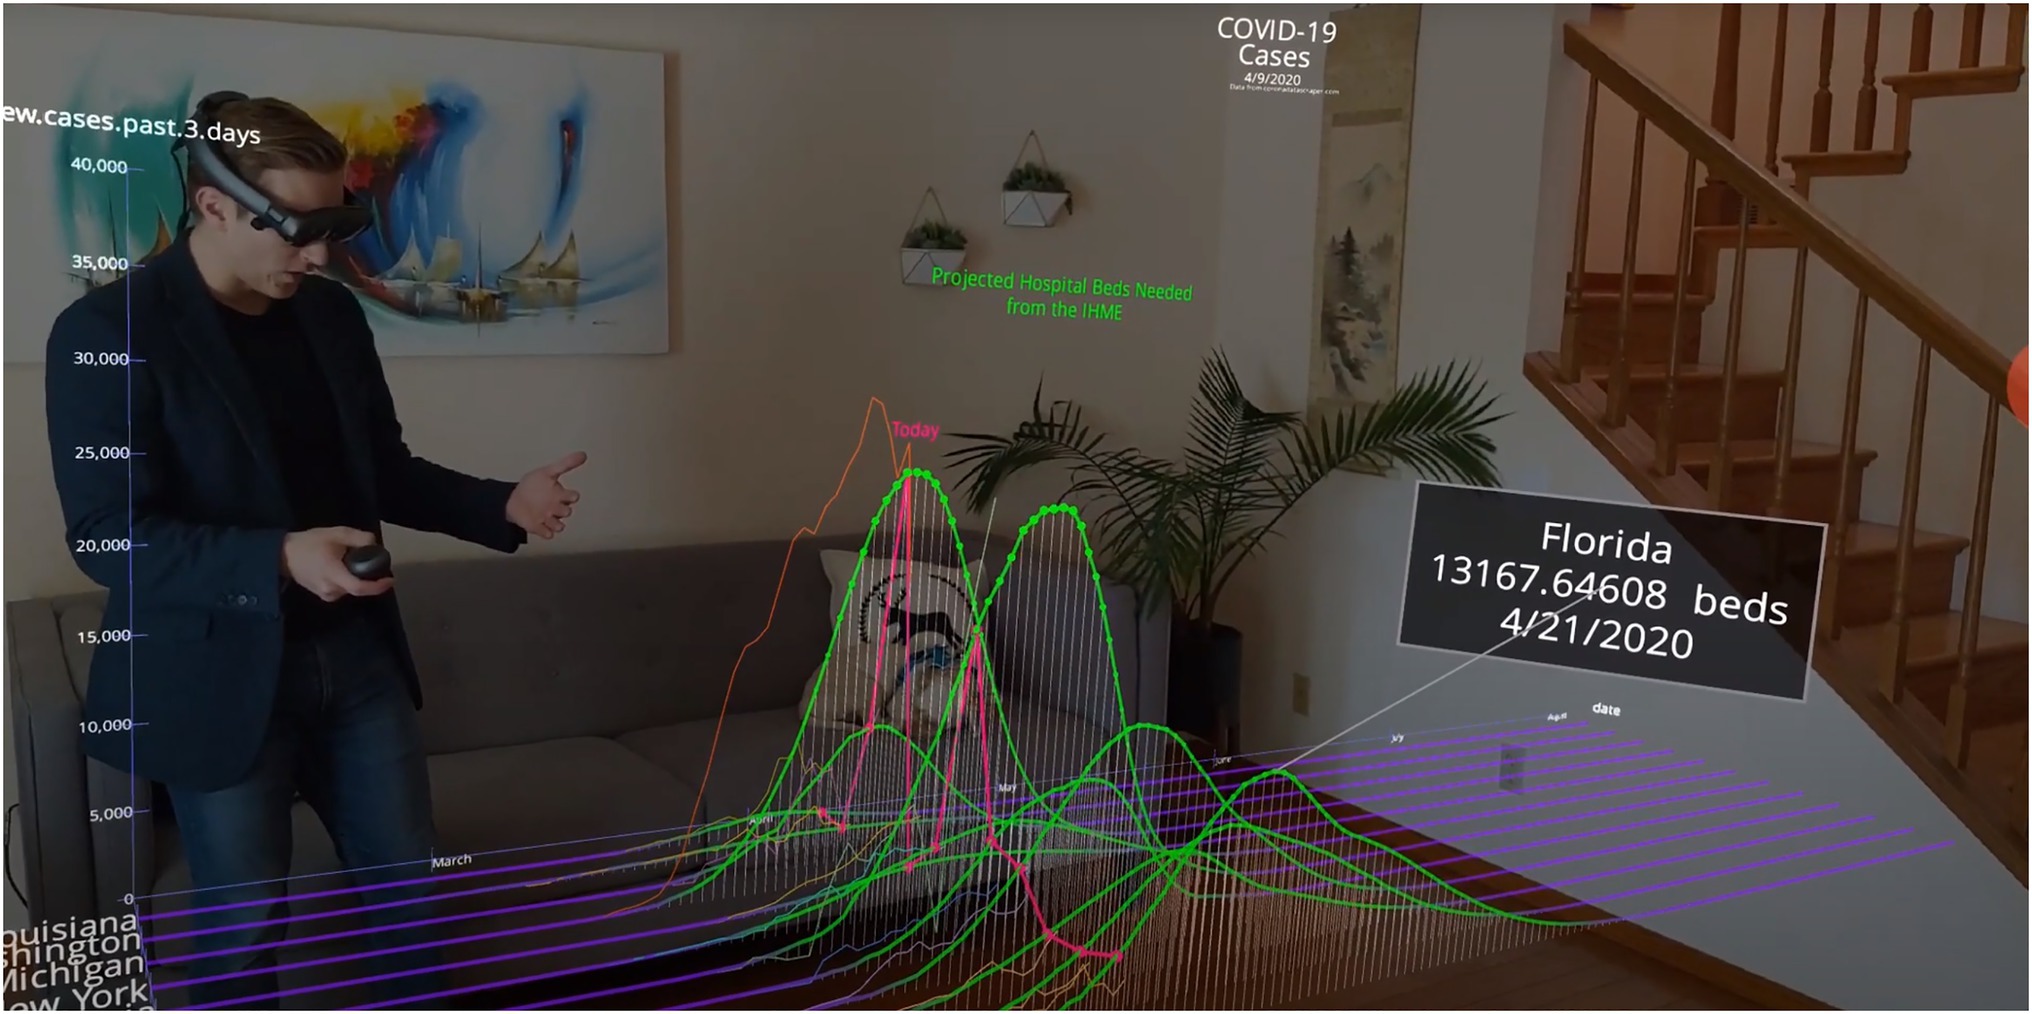
- AR data visualizations should seamlessly integrate with the user's real-world environment, using visual anchors and contextual cues to help users understand the relationship between the virtual data and their physical surroundings
- Aligns virtual data with real-world objects and surfaces to create a coherent experience
- Uses real-world scale and spatial relationships to provide context and meaning to the data (overlaying data on physical objects, mapping data to real-world locations)
- Interactive elements, such as hand gestures, voice commands, and gaze tracking, can be incorporated into VR and AR data visualizations to provide a more natural and intuitive user interface
- Allows users to manipulate and explore data using familiar and intuitive actions
- Reduces the learning curve and cognitive load associated with traditional input methods (keyboards, mice)
Optimization and Performance Considerations
- Data visualization designers should consider the limitations of current VR and AR hardware, such as display resolution, field of view, and tracking accuracy, when creating immersive experiences
- Adapts visualization design to work within the constraints of the target hardware
- Ensures that important data and visual elements are clearly visible and legible within the available display area
- Performance optimization techniques, such as level of detail rendering and occlusion culling, should be employed to ensure smooth and responsive VR and AR data visualizations, even when dealing with large and complex datasets
- Reduces the computational burden by dynamically adjusting the level of detail based on the user's viewpoint and proximity to the data
- Improves rendering performance by culling (removing) objects that are not visible from the user's perspective
Limitations of VR and AR for Data Visualization
Technical Constraints and Challenges
- Current VR and AR technologies have limited display resolution and field of view, which can impact the clarity and readability of data visualizations, particularly when dealing with high-density or text-heavy information
- May require simplification or abstraction of data to ensure legibility and comprehension
- Can limit the amount of data that can be effectively displayed simultaneously
- The lack of standardization in VR and AR hardware and software can make it difficult to create data visualizations that work consistently across different platforms and devices
- Requires developers to create multiple versions of the visualization to accommodate different hardware specifications and capabilities
- Can increase development time and cost, as well as limit the potential audience for the visualization
Accessibility and User Comfort
- VR and AR hardware can be expensive and may require specialized technical expertise to set up and maintain, which can limit their accessibility and adoption in some organizations
- May necessitate significant upfront investment in hardware, software, and training
- Can create barriers to entry for smaller organizations or those with limited technical resources
- Designing intuitive and effective interaction methods for VR and AR data visualizations can be challenging, as users may have varying levels of familiarity and comfort with these new technologies
- Requires careful consideration of user needs, preferences, and abilities
- May necessitate the development of multiple interaction modes or customizable settings to accommodate different user profiles
- VR and AR experiences can cause physical discomfort or motion sickness in some users, particularly with prolonged use or poorly designed experiences
- Can limit the duration and frequency of use, potentially reducing the effectiveness of the visualization
- Requires careful design and testing to minimize the risk of discomfort or adverse effects
Data Privacy and Security Concerns
- Ensuring data privacy and security can be a challenge in VR and AR environments, as the immersive nature of these technologies may make it easier for sensitive information to be inadvertently disclosed or accessed by unauthorized users
- Requires robust access control and authentication mechanisms to prevent unauthorized access to data
- May necessitate the development of secure data transmission and storage protocols to protect sensitive information
Impact of VR and AR on Data Understanding
Measuring Effectiveness and User Engagement
- User studies and evaluations should be conducted to measure the effectiveness of VR and AR data visualizations in improving user engagement, comprehension, and retention of complex information compared to traditional 2D visualizations
- Employs quantitative and qualitative research methods to gather data on user performance and experience
- Uses controlled experiments to isolate the effects of VR and AR on data understanding and decision-making
- Metrics such as time spent interacting with the visualization, accuracy of data interpretation, and user satisfaction can be used to assess the impact of VR and AR on user engagement and understanding
- Tracks user behavior and performance within the immersive environment
- Compares user outcomes and experiences across different visualization modalities (VR, AR, desktop, mobile)
Gathering User Feedback and Insights
- Qualitative feedback from users, such as interviews or surveys, can provide valuable insights into the strengths and weaknesses of VR and AR data visualizations and help identify areas for improvement
- Collects user opinions, preferences, and suggestions for enhancing the visualization design and functionality
- Identifies common challenges, frustrations, or points of confusion experienced by users
- Comparative studies can be designed to evaluate the performance of VR and AR data visualizations against other visualization techniques, such as desktop or mobile-based interactive visualizations, to determine their relative effectiveness in different contexts and use cases
- Assesses the suitability and added value of VR and AR for specific data types, tasks, and user groups
- Identifies the conditions under which VR and AR provide the greatest benefits over alternative visualization methods
Long-Term Impact and Knowledge Retention
- Long-term studies can be conducted to assess the impact of VR and AR data visualizations on users' ability to retain and apply complex information over time, as well as their potential for facilitating knowledge transfer and collaborative problem-solving
- Measures the persistence of learning and understanding gained through immersive visualization experiences
- Evaluates the effectiveness of VR and AR in promoting knowledge sharing and collaboration within and across teams
- Assesses the potential for VR and AR to support continuous learning and skill development in professional settings