😈Criminology Unit 2 Review
2.1 Official Crime Statistics and Their Limitations
2.1 Official Crime Statistics and Their Limitations
Unit & Topic Study Guides
Criminology: Definitions and Methods
Crime Data and Victimization Surveys
Classical and Neoclassical Criminology
Biological & Psychological Crime Theories
Sociological Theories: Structure & Process
Developmental Theories of Crime
Violent Crime
Property and White-Collar Crime
Organized Crime and Gangs
Victimology: Patterns and Relationships
Juvenile Delinquency and Justice
Policing
Courts: Structure, Process, and Sentencing
Prisons, Corrections, and Rehabilitation
Crime Prevention and Reduction Strategies
Sources and Limitations of Official Crime Statistics
Official crime statistics are the primary way we measure how much crime occurs in the United States. They come from law enforcement agencies that report data to national databases. But these numbers don't tell the whole story. Understanding where the data comes from and why it falls short is essential for anyone trying to interpret crime trends or compare crime rates across different places.
Sources of Official Crime Statistics
Two major systems collect crime data at the national level: the Uniform Crime Reports and the National Incident-Based Reporting System. They serve the same broad purpose but differ significantly in how much detail they capture.
Uniform Crime Reports (UCR)
The FBI has compiled the UCR since 1930, making it the longest-running national crime data program. Law enforcement agencies across the country voluntarily submit data on crimes reported to them.
- The UCR divides offenses into two categories:
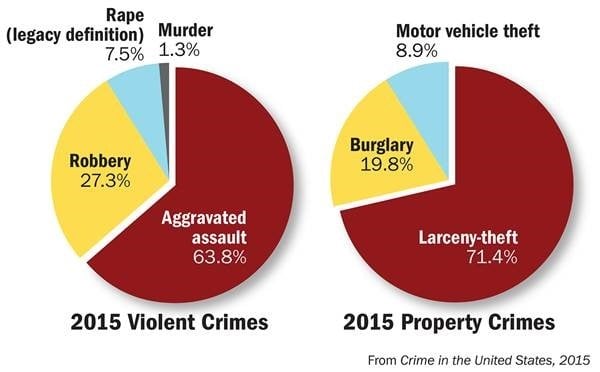
- Part I offenses (the most serious): murder, rape, robbery, aggravated assault, burglary, larceny-theft, motor vehicle theft, and arson
- Part II offenses (less serious but still tracked): simple assault, forgery, fraud, embezzlement, vandalism, weapons violations, prostitution, and drug abuse violations
- For Part I offenses, the UCR uses the hierarchy rule, meaning that when multiple crimes occur in a single incident, only the most serious offense gets counted. This means the UCR systematically undercounts certain crimes.
National Incident-Based Reporting System (NIBRS)
NIBRS was designed to replace the UCR with a far more detailed approach. Instead of just tallying offenses, it collects data on each individual crime incident.
- NIBRS records information about victims, offenders, and arrestees, including age, sex, race, and ethnicity. It also captures details about the circumstances of the crime, relationships between victims and offenders, and property involved.
- It does not use the hierarchy rule, so all offenses within a single incident get recorded. This gives a more complete picture of crime.
- The tradeoff is that NIBRS places a heavier reporting burden on agencies. As of 2021, only about 60% of U.S. law enforcement agencies participated in NIBRS, though the FBI officially transitioned to NIBRS as its national standard in that year.
Limitations of Crime Data
Even with these systems in place, official crime statistics have serious gaps. Three major issues stand out.
Underreporting
The biggest limitation is simple: many crimes never get reported to the police in the first place. If a crime isn't reported, it doesn't appear in official statistics.
- Victims may stay silent for many reasons. They might fear retaliation from the offender, feel ashamed, distrust the police, or believe that reporting won't lead to any meaningful outcome.
- Certain crime types have especially high underreporting rates. Sexual assault and domestic violence are consistently underreported due to stigma, fear, and the victim's relationship with the offender. The Bureau of Justice Statistics estimates that more than half of violent victimizations go unreported each year.
This means official statistics systematically underestimate the true amount of crime.
Inconsistent Definitions
What counts as a particular crime isn't always the same from one place to another, or even from one year to the next.
- Different states may classify the same behavior differently. For example, one state might treat a specific theft offense as a misdemeanor while another classifies it as a felony.
- Definitions also change over time. A notable example: the FBI expanded its definition of rape in 2013 to include offenses beyond the previous, much narrower definition. After the change, reported rape numbers appeared to spike, but this reflected the broader definition rather than an actual increase in assaults.
These inconsistencies make it difficult to compare crime data across jurisdictions or track trends over long periods.
Selective Reporting by Agencies
Not all agencies report their data with the same level of completeness or honesty.
- Some agencies may underreport certain crimes to maintain a favorable public image. For instance, downplaying property crime numbers can make a department look more effective at crime control.
- Political pressure, budget constraints, and staffing shortages can all influence what gets reported. Agencies with limited resources may focus on high-profile violent crimes and give less attention to recording minor offenses.

Police Discretion in Crime Reporting
Beyond the structural issues with data systems, individual officers and departments make daily decisions that shape what ends up in the statistics.
How discretion works: Officers decide whether to make an arrest, file a report, or handle a situation informally. Several factors influence these decisions:
- The severity of the offense (a minor drug possession case vs. an armed robbery)
- The offender's behavior during the encounter (cooperative vs. confrontational)
- The victim's preferences (whether they want to press charges)
- Department policies and informal norms about how to handle certain situations
This discretion is a normal part of policing, but it introduces inconsistency. Two officers responding to similar incidents might handle them differently, and two departments in neighboring cities might have very different thresholds for what gets formally recorded.
Varying reporting thresholds compound the problem. One agency might report every theft, while another only records thefts above a certain dollar value. Some departments prioritize tracking violent crime while giving less attention to property offenses.
The result is that official statistics tend to overrepresent crimes that are almost always reported (like murder, which is hard to conceal) and underrepresent crimes that depend more heavily on victim reporting and officer discretion (like domestic violence or minor drug offenses).
Challenges in Crime Rate Comparisons
Given all these limitations, comparing crime rates between different areas or across different time periods requires real caution.
Data collection differences create practical obstacles. Some agencies still rely on paper-based incident reports while others use electronic systems. The ongoing transition from UCR to NIBRS has introduced its own inconsistencies, since NIBRS captures a wider range of offenses in greater detail. Jurisdictions that adopted NIBRS earlier may show different crime patterns than those still using the older system, even if actual crime levels are similar.
Demographic and socioeconomic factors also complicate comparisons. Crime rates are influenced by population size, age distribution, poverty levels, education, and employment conditions. Comparing a large urban center to a rural county without accounting for these differences can produce misleading conclusions.
Legislative changes can shift the numbers without any change in actual behavior. When states decriminalize marijuana, for example, drug arrest numbers drop. That reflects a policy change, not a change in how many people use marijuana.
When interpreting crime statistics, you should always ask:
- Where did this data come from, and which reporting system was used?
- What population and demographic differences exist between the areas being compared?
- Have any relevant laws, definitions, or reporting practices changed during the time period in question?
- What types of crime are most likely to be missing from these numbers?
Keeping these questions in mind will help you avoid drawing conclusions that the data can't actually support.