Formulas
For these problems you are given a sample mean. The average of sample means is equal to the given mean.


For the standard deviation, when you deal with sample statistics, you must use standard error (SE). This version of standard deviation, which is used for population proportions in this case, is another comparison that must be memorized just like the chart in section 5.1.
Normal Condition: Central Limit Theorem
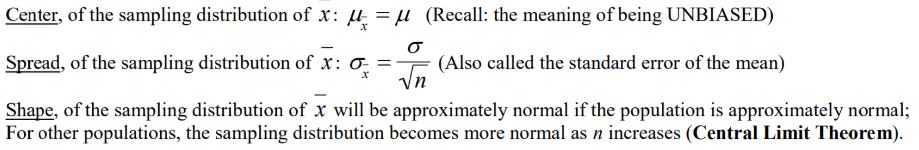
When you are working with numerical data and you want to estimate the mean of a population, you can use the sampling distribution of the sample mean (x̄) to make inferences about the population mean. However, before you can solve the problem, you must first assure the sampling distribution is normally distributed using the Central Limit Theorem.
One important property of the sampling distribution of the sample mean is that it is approximately normal, provided the sample size is large enough. This means that even if the population distribution is not normal, the sampling distribution of the sample mean can be modeled using a normal distribution if the sample size is large enough.
The "large enough" sample size is often taken to be 30 or greater. This is known as the Central Limit Theorem, which states that the sampling distribution of the sample mean becomes approximately normal as the sample size increases, regardless of the shape of the population distribution. ⬭
Practice Problem
Suppose that you are conducting a study to estimate the average income of small business owners in your state. You decide to use a simple random sample of 100 small business owners, and you collect data on their annual incomes. After analyzing the data, you find that the sample mean income is 10,000.
a) Explain what the sampling distribution for the sample mean represents and why it is useful in this situation.
b) Suppose that the true population mean income for small business owners in your state is actually $$45,000 per year. Describe the shape, center, and spread of the sampling distribution for the sample mean in this case.
c) Explain why the Central Limit Theorem applies to the sampling distribution for the sample mean in this situation.
d) Discuss one potential source of bias that could affect the results of this study, and explain how it could influence the estimate of the population mean income.
Answer
a) The sampling distribution for the sample mean represents the distribution of possible values for the sample mean if the study were repeated many times. It is useful in this situation because it allows us to make inferences about the population mean based on the sample data.
b) If the true population mean income for small business owners in your state is 45,000 and a spread that depends on the sample size and the variability of the population.
c) The Central Limit Theorem applies to the sampling distribution for the sample mean in this situation because the sample size (n = 100) is large enough for the distribution to be approximately normal, even if the population is not normally distributed.
d) One potential source of bias in this study could be selection bias, which occurs when certain groups of individuals are more or less likely to be included in the sample. For example, if the sample is drawn from a list of small business owners who have registered with a particular organization, it could be biased toward those who are more financially successful or who are more likely to be active members of the organization. This could lead to an overestimate of the population mean income for small business owners in the state.
On the other hand, if the sample is drawn from a list of small business owners who have applied for a particular loan program, it could be biased toward those who are less financially successful or who are more likely to be in need of financial assistance. This could lead to an underestimate of the population mean income.
Vocabulary
The following words are mentioned explicitly in the College Board Course and Exam Description for this topic.
| Term | Definition |
|---|---|
| normal distribution | A probability distribution that is mound-shaped and symmetric, characterized by a population mean (μ) and population standard deviation (σ). |
| parameter | A numerical summary that describes a characteristic of an entire population. |
| population | The entire group of individuals or items from which a sample is drawn and about which conclusions are to be made. |
| population distribution | The distribution of all values of a variable across the entire population. |
| population mean | The average of all values in an entire population, denoted as μ. |
| population means | The average values of two distinct populations being compared, denoted as μ₁ and μ₂. |
| population size | The total number of individuals or items in an entire population. |
| probability | The likelihood or chance that a particular outcome or event will occur, expressed as a value between 0 and 1. |
| random sampling with replacement | A sampling method where each selected item is returned to the population before the next selection, allowing the same item to be selected multiple times. |
| random sampling without replacement | A sampling method where each selected item is not returned to the population, so each item can only be selected once. |
| sample mean | The average of all values in a sample, denoted as x̄, used as an estimate of the population mean. |
| sample size | The number of observations or data points collected in a sample, denoted as n. |
| sampling distribution | The probability distribution of a sample statistic (such as a sample proportion) obtained from repeated sampling of a population. |
| standard deviation | A measure of how spread out data values are from the mean, represented by σ in the context of a population. |
Frequently Asked Questions
How do I find the mean and standard deviation of a sampling distribution for sample means?
For a sample mean x̄ from a population with mean μ and standard deviation σ (random sampling): - Mean of the sampling distribution: μx̄ = μ. The sample mean is an unbiased estimator of the population mean (UNC-3.Q.1). - Standard deviation (standard error): σx̄ = σ / √n. This shrinks as n grows—bigger samples give more precise x̄ (UNC-3.Q.1). If you sample without replacement, the true σx̄ is slightly smaller; the finite-population correction is negligible when the sample is <10% of the population (10% condition, UNC-3.Q.2). To use a normal model for x̄, either the population is normal (UNC-3.R.1) or n ≥ ~30 so the CLT gives an approximately normal sampling distribution (UNC-3.R.2). These are AP-tested basics—review Topic 5.7 in the Fiveable study guide (https://library.fiveable.me/ap-statistics/unit-5/sampling-distributions-for-sample-means/study-guide/JcwkFAqbdjfLgHUdojkE) and practice lots of problems (https://library.fiveable.me/practice/ap-statistics).
What's the formula for the standard error when I'm sampling with replacement?
If you sample with replacement (so observations are independent), the standard error of the sample mean is σ_x̄ = σ / √n where σ is the population standard deviation and n is the sample size (this is UNC-3.Q.1 in the CED). If you don’t know σ, use the sample standard deviation s and the estimate s_x̄ = s / √n. Remember: if you sample without replacement the true standard deviation is a bit smaller and you’d multiply by the finite population correction factor √((N − n)/ (N − 1)); that correction is negligible when n < 10% of the population (the 10% condition in the CED). This formula and the independence/normal-approximation conditions are exactly what AP asks you to know for Topic 5.7—see the topic study guide (https://library.fiveable.me/ap-statistics/unit-5/sampling-distributions-for-sample-means/study-guide/JcwkFAqbdjfLgHUdojkE) and Unit 5 overview (https://library.fiveable.me/ap-statistics/unit-5). For extra practice, try problems at (https://library.fiveable.me/practice/ap-statistics).
When do I use the Central Limit Theorem vs when the population is already normal?
Use the population’s shape first. If the population distribution is normal, the sampling distribution of x̄ is exactly normal for any sample size n (CED: UNC-3.R.1). So you can use μx̄ = μ and σx̄ = σ/√n and do z or t work even with small n. If the population is not normal, invoke the Central Limit Theorem (CED: UNC-3.R.2): for large n the sampling distribution of x̄ is approximately normal. A common AP rule of thumb is n ≥ 30, but if the population is very skewed or has strong outliers you’ll need larger n; if it’s only mildly skewed, smaller n might be OK. Always check independence (random sampling or random assignment) and the 10% condition when sampling without replacement. On the exam, explicitly state which condition you’re using (population normal vs. CLT) and cite n, shape, and independence (see the Topic 5.7 study guide for examples: https://library.fiveable.me/ap-statistics/unit-5/sampling-distributions-for-sample-means/study-guide/JcwkFAqbdjfLgHUdojkE). For more review and practice problems, see the Unit 5 overview (https://library.fiveable.me/ap-statistics/unit-5) and practice bank (https://library.fiveable.me/practice/ap-statistics).
I'm confused about sampling distributions - what's the difference between the population mean and the sample mean distribution?
Short answer: the population mean μ is a fixed number—the true average for every individual in the population. The sampling distribution of the sample mean x̄ describes how x̄ would vary if you repeatedly take random samples of size n from that population. Key CED facts: the sampling distribution has mean μx̄ = μ and standard error σx̄ = σ/√n (if sampling with replacement or population ≫ n). If you sample without replacement and n is less than 10% of the population, that σ/√n formula is still fine (10% condition). Normal shape: x̄ is exactly normal if the population is normal; otherwise the Central Limit Theorem makes x̄ approximately normal once n is large (common rule: n ≥ 30). These ideas are part of Topic 5.7 (Unit 5) for AP Stats—see the Fiveable study guide (https://library.fiveable.me/ap-statistics/unit-5/sampling-distributions-for-sample-means/study-guide/JcwkFAqbdjfLgHUdojkE) and try practice problems (https://library.fiveable.me/practice/ap-statistics) to cement this.
What does it mean when they say the sample size needs to be greater than or equal to 30?
Saying "sample size n ≥ 30" is a rule of thumb from the Central Limit Theorem: if the population distribution is not normal, the sampling distribution of the sample mean x̄ will be approximately normal once n is large enough (commonly n ≥ 30), so you can use Normal-based methods. Key points for AP Stats (CED): the sampling distribution has mean μx̄ = μ and standard error σx̄ = σ/√n (UNC-3.Q.1). Conditions: samples must be independent (use randomness) and, when sampling without replacement, n should be ≤ 10% of the population so the σ/√n formula is okay (10% condition, UNC-3.Q.2). If the population itself is normal, x̄ is exactly normal for any n (UNC-3.R.1). For more on this topic and AP-style practice, see the Topic 5.7 study guide (https://library.fiveable.me/ap-statistics/unit-5/sampling-distributions-for-sample-means/study-guide/JcwkFAqbdjfLgHUdojkE) and Unit 5 overview (https://library.fiveable.me/ap-statistics/unit-5). For lots of practice problems, visit (https://library.fiveable.me/practice/ap-statistics).
How do I know if I can assume the sampling distribution is approximately normal?
You can assume the sampling distribution of x̄ is approximately normal when two main conditions from the CED are met: 1) Independence: your sample must be random and either sampled with replacement or (if without) be less than 10% of the population so observations are effectively independent (the 10% condition). 2) Shape / sample size: - If the population is (approximately) normal, x̄ is normal for any n (UNC-3.R.1). - If the population is not normal, use the Central Limit Theorem: x̄ is approximately normal when n is large—a common rule of thumb is n ≥ 30 (UNC-3.R.2). Larger n is needed if the population is highly skewed or has strong outliers. Also remember the sampling distribution’s mean = μ and standard error = σ/√n (or s/√n when σ unknown). On the AP exam you should state/check these conditions before using z/t methods. For a concise review, see the Topic 5.7 study guide (https://library.fiveable.me/ap-statistics/unit-5/sampling-distributions-for-sample-means/study-guide/JcwkFAqbdjfLgHUdojkE) and try practice problems (https://library.fiveable.me/practice/ap-statistics).
What's the 10% rule and when do I need to worry about it?
The 10% rule is an independence check for sampling without replacement: if your sample size n is less than 10% of the population size N (n < 0.10N), you can treat sampled observations as (approximately) independent and use the usual sampling distribution formulas (μx̄ = μ and σx̄ = σ/√n). If n is NOT less than 10% of N (i.e., you sampled more than 10% of the population), the standard error σ/√n overestimates the true variability—the finite population correction (FPC) applies and the SD of x̄ is smaller. When to worry: only when you sample without replacement from a finite population and your sample is a large fraction (>10%). For most AP problems they either state sampling is random (often implying independence) or give population size so you can check the 10% condition—you’ll be expected to verify this for inference (UNC-3.Q.2). For a refresher, see the Topic 5.7 study guide (https://library.fiveable.me/ap-statistics/unit-5/sampling-distributions-for-sample-means/study-guide/JcwkFAqbdjfLgHUdojkE) and more practice at (https://library.fiveable.me/practice/ap-statistics).
Can someone explain step by step how to find the probability that a sample mean falls within a certain range?
Step-by-step: 1. Check conditions. Are observations independent (random sample or randomized experiment) and is n < 10% of the population if sampling without replacement? Is the sampling distribution approximately normal—either the population is normal or n ≥ 30 (Central Limit Theorem)? (See Topic 5.7 study guide: https://library.fiveable.me/ap-statistics/unit-5/sampling-distributions-for-sample-means/study-guide/JcwkFAqbdjfLgHUdojkE) 2. Identify parameters. Population mean μ and population standard deviation σ (or use s if σ unknown). For the sampling distribution of the sample mean x̄, μx̄ = μ and σx̄ = σ/√n (standard error). 3. Convert the range to z-scores: z = (x̄ - μx̄) / σx̄ for each endpoint. 4. Use the standard normal table or calculator to find probabilities: P(a < x̄ < b) = P(z_a < Z < z_b) = Φ(z_b) − Φ(z_a). If σ is unknown and n is small, use t-distribution with df = n−1 for inference (AP exam expects you to verify conditions and choose normal vs t). Practice these steps on many problems—Fiveable has a unit overview and lots of practice sets (https://library.fiveable.me/ap-statistics/unit-5 and https://library.fiveable.me/practice/ap-statistics).
Why is the standard deviation of the sample mean equal to sigma divided by square root of n?
Think of the sample mean x̄ as the average of n independent random draws. Each draw has variance σ^2. When you add independent random variables, variances add, so the variance of the sum is nσ^2. The mean x̄ is that sum divided by n, so its variance is (1/n^2)·(nσ^2) = σ^2/n. Take the square root to get the standard deviation: σ/√n. That’s the standard error of the mean—it measures how much sample means vary from sample to sample. Two quick AP notes from the CED: this formula assumes independent sampling (use the 10% condition if sampling without replacement), and it’s listed in UNC-3.Q as σx̄ = σ/√n. The Central Limit Theorem tells you when the sampling distribution will be approximately normal (useful for inference on the exam). For a short study review, see the Topic 5.7 study guide (https://library.fiveable.me/ap-statistics/unit-5/sampling-distributions-for-sample-means/study-guide/JcwkFAqbdjfLgHUdojkE); for more unit review and practice, check Unit 5 (https://library.fiveable.me/ap-statistics/unit-5) and the practice problems (https://library.fiveable.me/practice/ap-statistics).
I don't understand when to use the finite population correction factor - do I need it for the AP exam?
Short answer: you only need the finite population correction (FPC) when you're sampling WITHOUT replacement from a finite population and your sample is more than 10% of that population. The CED states that when n < 0.10N the difference is negligible, so you can use σx̄ = σ/√n without correction. If n is NOT < 10% of N, use the FPC: σx̄ = (σ/√n)·√((N−n)/(N−1)). On the AP exam most sampling problems either assume replacement/large populations or tell you when to worry—so apply the 10% rule when checking independence (UNC-3.Q.2 / UNC-3.R). If a problem gives a small finite population and a large sample (e.g., sample is 20% of population), include the FPC and show you checked the 10% condition. For a quick review see the Topic 5.7 study guide (https://library.fiveable.me/ap-statistics/unit-5/sampling-distributions-for-sample-means/study-guide/JcwkFAqbdjfLgHUdojkE) and more unit practice at (https://library.fiveable.me/ap-statistics/unit-5) or thousands of practice problems (https://library.fiveable.me/practice/ap-statistics).
What's the difference between sampling with replacement and without replacement for sample means?
Sampling with replacement vs without replacement only changes the spread (standard deviation) of the sampling distribution of x̄—not the center. - With replacement (or when you can treat draws as independent): μx̄ = μ and σx̄ = σ/√n. This is the standard error used on the AP (UNC-3.Q.1). - Without replacement: the sample values are slightly dependent, so the standard deviation is smaller. Use the finite-population correction (FPC): σx̄ = (σ/√n) · sqrt((N − n)/(N − 1)). If n is less than 10% of N, sqrt((N−n)/(N−1)) ≈ 1 and the difference is negligible (the AP “10% condition,” UNC-3.Q.2). Also remember normality rules (UNC-3.R): if the population is normal, x̄ is exactly normal; if not, x̄ is approximately normal for large n (≈30) by the CLT. For a focused review, see the Topic 5.7 study guide (https://library.fiveable.me/ap-statistics/unit-5/sampling-distributions-for-sample-means/study-guide/JcwkFAqbdjfLgHUdojkE) and try practice problems at (https://library.fiveable.me/practice/ap-statistics).
How do I solve problems where they ask for the probability that the sample mean is greater than some value?
Think of the sample mean x̄ as its own random variable with mean μx̄ = μ and standard error σx̄ = σ/√n (or s/√n if σ is unknown). Steps to find P(x̄ > a): 1. Check conditions: independence (random sample, 10% condition if without replacement) and approximate normality (population normal or n ≥ 30 by the CLT). 2. Compute the center and spread: μx̄ = μ, SE = σ/√n (or use s and switch to t-distribution if σ unknown and n small). 3. Standardize: z = (a − μx̄) / SE. 4. Find the tail probability: P(x̄ > a) = 1 − Φ(z) for a normal (or use a t-table / calculator with df = n−1 if using t). Example: μ=100, σ=15, n=36, a=105 → SE=15/6=2.5, z=(105−100)/2.5=2 → P=1−Φ(2)≈0.0228. For more review on Topic 5.7 and worked examples, see the Fiveable study guide (https://library.fiveable.me/ap-statistics/unit-5/sampling-distributions-for-sample-means/study-guide/JcwkFAqbdjfLgHUdojkE) and the Unit 5 overview (https://library.fiveable.me/ap-statistics/unit-5). For more practice, try the AP problems at (https://library.fiveable.me/practice/ap-statistics).
When the population distribution is skewed, how large does my sample size need to be for the CLT to work?
If the population is noticeably skewed, the CED’s rule of thumb is that the sampling distribution of x̄ will be approximately normal once n is “large enough,” typically n ≥ 30 (UNC-3.R.2). So for mildly skewed populations, n ≈ 30 usually works; for strongly skewed or heavy-tailed populations you’ll want a larger n (often 50–100) before the CLT gives a good normal approximation. Always check the independence condition (random sampling or random assignment) and the 10% condition when sampling without replacement—the standard error formula σ/√n is fine if n < 10% of the population (UNC-3.Q.2). On the AP exam, justify normal approximation by citing population shape, sample size, and these conditions (UNC-3.R). For practice and extra examples on this topic, see the Topic 5.7 study guide (https://library.fiveable.me/ap-statistics/unit-5/sampling-distributions-for-sample-means/study-guide/JcwkFAqbdjfLgHUdojkE) and more practice problems (https://library.fiveable.me/practice/ap-statistics).
What does it mean to interpret probabilities "in context" for sampling distribution problems?
Interpreting probabilities “in context” means you don’t just quote a z-score or a number—you explain what that probability says about the real population and measurement with units. For sampling distributions of x̄, start by naming the population, the parameter (μ), the sample size (n), and the standard error (σ/√n or s/√n). If you compute P(x̄ > 78) = 0.10, say: “There’s about a 10% chance that a random sample of n = 36 from this population will have a mean greater than 78 units,” noting units (e.g., minutes, kg) and any conditions used (CLT or population normality, independence/10% condition). On the AP exam you’re expected to tie probabilities back to context (UNC-3.S.1): state the parameter, reference repeated sampling or long run, and include units. For a quick review, check Topic 5.7 study guide (https://library.fiveable.me/ap-statistics/unit-5/sampling-distributions-for-sample-means/study-guide/JcwkFAqbdjfLgHUdojkE). For extra practice, see Fiveable’s Unit 5 resources (https://library.fiveable.me/ap-statistics/unit-5) or the practice problems (https://library.fiveable.me/practice/ap-statistics).
I keep getting confused about units - how do I make sure I'm interpreting the standard error correctly?
Think of the standard error as “how much sample means wiggle” in the same units as the original data. If your population values are in kilograms, the standard error of x̄ (σx̄ = σ/√n or s/√n when σ is unknown) is also in kilograms. That means when you say “SE = 0.5 kg,” you’re saying typical sample means are about 0.5 kg away from the population mean. Make these checks every time: - Use the same units as the data (don’t mix % with minutes, etc.). UNC-3.S.1 requires interpretation in context and units. - If sampling without replacement and n > 10% of the population, apply the finite population correction (SE gets smaller). - Remember SE shrinks like 1/√n—bigger n → smaller SE, more precise x̄. - For probability statements or CIs, ensure the sampling distribution is approx normal (population normal or CLT n ≥ ~30; see UNC-3.R). For a clear walkthrough and AP-style examples, check the Topic 5.7 study guide (https://library.fiveable.me/ap-statistics/unit-5/sampling-distributions-for-sample-means/study-guide/JcwkFAqbdjfLgHUdojkE) and try practice questions at Fiveable (https://library.fiveable.me/practice/ap-statistics).