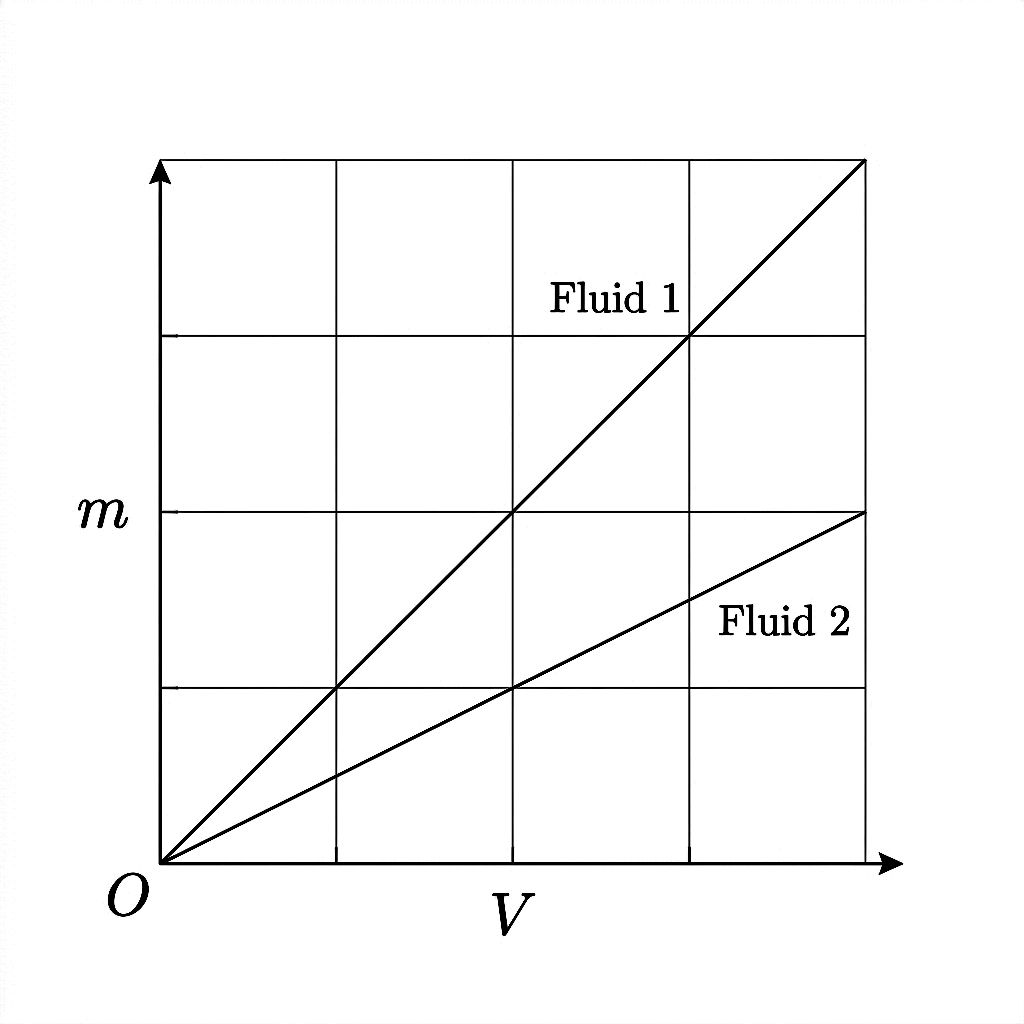
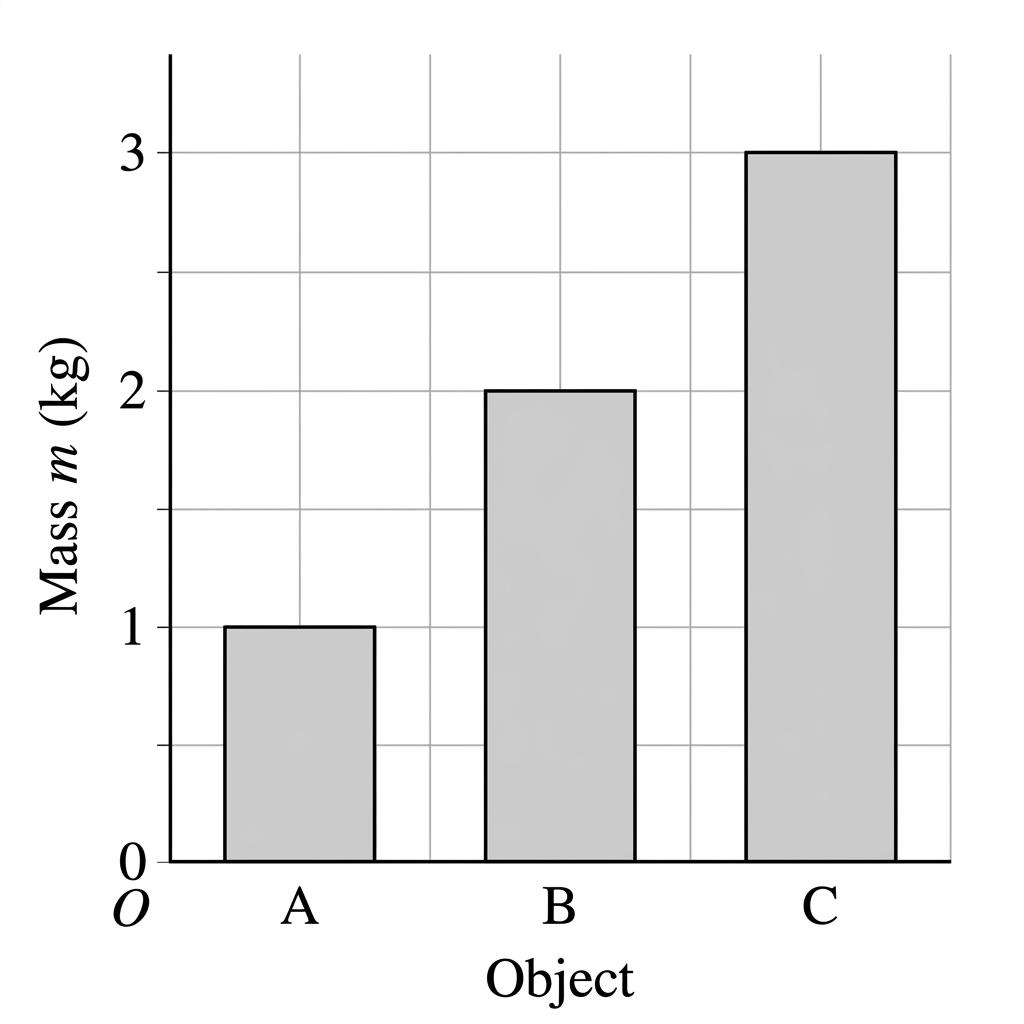
Start with density and ideal fluid properties (8.1)Read the 8.1 topic guide and practice calculating density using rho = m/V. Make sure you can distinguish solids, liquids, and gases by intermolecular forces and explain what makes a fluid ideal. This foundation is required for every other topic in the unit.
Work through pressure at a surface and with depth (8.2)Practice applying P = F_perp/A and P = P0 + rho*g*h to numerical problems. Drill the difference between absolute and gauge pressure. Use the 8.2 topic guide and attempt several practice questions that vary depth and reference pressure.
Build buoyancy skills with free-body diagrams (8.3)For every buoyancy problem, draw the free-body diagram first: weight down, buoyant force up. Apply Fb = rho_fluid*V_displaced*g and Newton's second law. Practice floating, sinking, and equilibrium scenarios using the 8.3 topic guide and available FRQ practice.
Practice continuity and Bernoulli problems (8.4)Work through pipe-flow problems using A1v1 = A2v2 before adding Bernoulli's equation. Then practice full Bernoulli setups that combine pressure, height, and speed changes. Finish with Torricelli's theorem problems. The 8.4 topic guide and FRQ practice are available for this topic.
Do a full unit review and use the score calculatorAfter covering all four topics, attempt mixed fluids problems that combine density, pressure, buoyancy, and flow in a single scenario. Use the AP score calculator to estimate where your performance puts you on the exam scale and identify which topics need more attention.
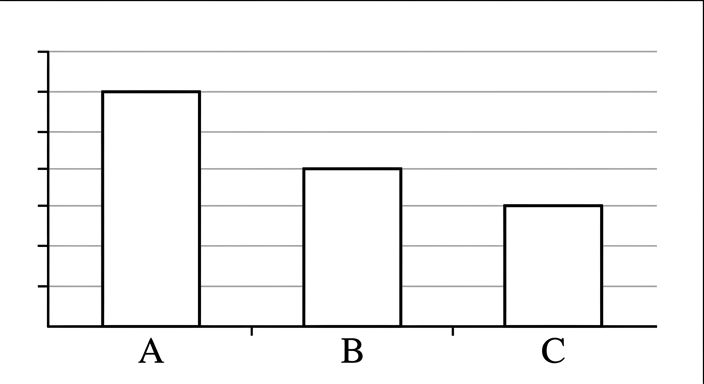

![Bar chart template with fully specified axes and categories for pressures at cross section 1.
Axes:
- Vertical axis label: "Pressure (Pa)".
- Vertical axis range: from [value removed — blank template] at the dashed zero line up to 1.40×10⁵ Pa at the top of the axis.
- Vertical tick marks and labels at every 2.0×10⁴ Pa: show visible tick labels "0", "2.0×10⁴", "4.0×10⁴", "6.0×10⁴", "8.0×10⁴", "1.0×10⁵", "1.2×10⁵", "1.4×10⁵".
- A bold dashed horizontal line across the plot at [value removed — blank template] labeled "0" at the y-axis (this dashed line is the required start line for all shaded bars).
- Horizontal axis label centered below categories: "Pressure components".
- Three category tick positions, left-to-right, equally spaced: "P_g", "P_atm", "P_total".
- No arrows on the ends of the axes (template style).
- The origin is shown implicitly at the intersection of the left axis and the dashed 0 line, with the tick label "0".
Bars (template placeholders; unshaded outlines so students can shade):
- Three empty bar rectangles (white fill) with black outlines (1.5 pt stroke), one centered under each category.
- Uniform bar width: each bar occupies exactly one-half of the horizontal spacing between adjacent category centers, leaving equal gaps on both sides.
- Each bar rectangle base sits exactly on the dashed [value removed — blank template] line.
- Each bar rectangle extends upward to the top y-limit (1.40×10⁵ Pa) as an empty container outline to indicate the drawable region.
Distinct zero-pressure marker rule (printed on the figure):
- Under the plot (small text): "If a pressure equals zero, draw a single horizontal line on the [value removed — blank template] dashed line in that column."](/_next/image?url=https%3A%2F%2Fkcbwzropdukwhmmvdylp.supabase.co%2Fstorage%2Fv1%2Fobject%2Fpublic%2Ffrq_stimulus%2Fap-physics-1-revised%2Fabb4b4bf-2d54-4045-b8ef-b27527915ede_fig2.jpg&w=1080&q=75)
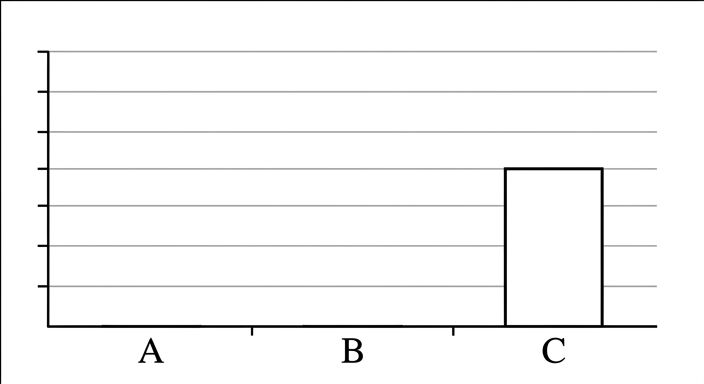
![Bar chart template identical in scale and formatting to Figure 2, for pressures at cross section 2.
Axes:
- Vertical axis label: "Pressure (Pa)".
- Vertical axis range: [value removed — blank template] to 1.40×10⁵ Pa.
- Vertical tick marks and labels at every 2.0×10⁴ Pa: visible tick labels "0", "2.0×10⁴", "4.0×10⁴", "6.0×10⁴", "8.0×10⁴", "1.0×10⁵", "1.2×10⁵", "1.4×10⁵".
- A bold dashed horizontal line across the plot at [value removed — blank template].
- Horizontal axis label: "Pressure components".
- Three equally spaced category labels left-to-right: "P_g", "P_atm", "P_total".
- No arrows on the axes.
Bars (template placeholders; unshaded outlines so students can shade):
- Three empty bar rectangles (white fill) with black outlines (1.5 pt stroke), one per category.
- Uniform bar width: each bar occupies exactly one-half of the spacing between category centers.
- Bar bases lie exactly on the dashed [value removed — blank template] line; bar containers extend upward to the 1.40×10⁵ Pa top limit.
Printed rule under the plot (same as Figure 2):
- "If a pressure equals zero, draw a single horizontal line on the [value removed — blank template] dashed line in that column."](/_next/image?url=https%3A%2F%2Fkcbwzropdukwhmmvdylp.supabase.co%2Fstorage%2Fv1%2Fobject%2Fpublic%2Ffrq_stimulus%2Fap-physics-1-revised%2Fabb4b4bf-2d54-4045-b8ef-b27527915ede_fig3.jpg&w=1080&q=75)
![Completed reference bar chart giving the pressure components for the water immediately below the piston, with explicit numeric bar heights and non-zero error bars.
Compute the shown values (must be printed as bar heights):
- P_atm = 1.01×10⁵ Pa.
- Gauge pressure under piston equals piston weight per area: P_g = (m_p g)/A_p = (3.0 kg × 9.8 m/s²) / (2.0×10⁻³ m²) = 1.47×10⁴ Pa (shown as 1.47×10⁴ Pa).
- Total pressure: P_total = P_atm + P_g = 1.16×10⁵ Pa (shown as 1.16×10⁵ Pa).
Axes:
- Vertical axis label: "Pressure (Pa)".
- Vertical axis range: [value removed — blank template] to 1.40×10⁵ Pa.
- Vertical tick marks and labels every 2.0×10⁴ Pa: "0", "2.0×10⁴", "4.0×10⁴", "6.0×10⁴", "8.0×10⁴", "1.0×10⁵", "1.2×10⁵", "1.4×10⁵".
- Dashed horizontal line at [value removed — blank template] across the plot.
- Horizontal axis label: "Pressure components".
- Categories left-to-right: "P_g", "P_atm", "P_total".
- No arrows on axes.
Bars:
- Three solid medium-gray bars with black outlines (1.5 pt stroke), all with identical widths (each bar occupies exactly one-half of the spacing between category centers).
- Bar 1 (category "P_g"): height exactly 1.47×10⁴ Pa.
- Bar 2 (category "P_atm"): height exactly 1.01×10⁵ Pa.
- Bar 3 (category "P_total"): height exactly 1.16×10⁵ Pa.
- All bars start exactly at the dashed [value removed — blank template] line.
Error bars (must be drawn above each bar with caps):
- Use symmetric vertical error bars with black lines and horizontal caps.
- Cap width: one-third of the bar width.
- Bar "P_g": mean 1.47×10⁴ Pa, error bar endpoints at 1.32×10⁴ Pa and 1.62×10⁴ Pa (±1.5×10³ Pa).
- Bar "P_atm": mean 1.01×10⁵ Pa, error bar endpoints at 9.60×10⁴ Pa and 1.06×10⁵ Pa (±5.0×10³ Pa).
- Bar "P_total": mean 1.16×10⁵ Pa, error bar endpoints at 1.10×10⁵ Pa and 1.22×10⁵ Pa (±6.0×10³ Pa).
Title text placed above the plotting area:
- "Water just under piston"](/_next/image?url=https%3A%2F%2Fkcbwzropdukwhmmvdylp.supabase.co%2Fstorage%2Fv1%2Fobject%2Fpublic%2Ffrq_stimulus%2Fap-physics-1-revised%2Fabb4b4bf-2d54-4045-b8ef-b27527915ede_fig4.jpg&w=1080&q=75)

![Single 2D plot with axes and one pre-drawn curve for the dynamic term. Students add two additional labeled curves.
Axes:
- Horizontal axis label: "Location along flow" (no units).
- Horizontal axis range: from 0 to 3.
- Horizontal tick marks and labels at 0, 1, 2, 3.
- The three labeled locations align exactly with tick marks:
- At x-tick 1: label directly below axis: "1" and beneath it (smaller text): "cross section 1".
- At x-tick 2: label: "2" and beneath it: "cross section 2".
- At x-tick 3: label: "3" and beneath it: "just under piston".
- Vertical axis label: "Energy per unit volume (Pa)".
- Vertical axis range: from [value removed — blank template] to 1.40×10⁵ Pa.
- Vertical tick marks and labels every 2.0×10⁴ Pa: "0", "2.0×10⁴", "4.0×10⁴", "6.0×10⁴", "8.0×10⁴", "1.0×10⁵", "1.2×10⁵", "1.4×10⁵".
- The origin is explicitly labeled "0" at the intersection of the axes.
- Arrows on the positive ends of both axes.
- No grid lines.
Pre-drawn curve (dynamic term):
- A solid black curve labeled "dynamic term (½ρv²)" placed near the curve.
- From location 1 to location 2: the curve is a straight rising line segment (no curvature) showing an increase.
- From location 2 to location 3: the curve is a perfectly horizontal line segment (constant value).
- The dynamic-term curve is drawn so that at location 1 it sits at exactly one-quarter of the full y-range (i.e., at the tick value 3.5×10⁴ Pa), and at locations 2 and 3 it sits at exactly one-half of the full y-range (i.e., at the tick value 7.0×10⁴ Pa). These tick values must be used as the endpoints of the drawn line segments so the increases are numerically locked to the axis.
Student-added curves (blank space reserved):
- Provide no additional curves, but include two empty label callouts (text only, with short leader lines pointing to blank regions): "pressure term P" and "gravitational term ρgh".
- The blank space should clearly allow students to draw:
- A pressure-term curve spanning locations 1→2→3.
- A gravitational-term curve spanning locations 1→2→3.
Styling:
- All axes and ticks in black.
- Dynamic curve in black, medium thickness.
- Labels in plain sans-serif font; use Greek rho "ρ" in "½ρv²" and "ρgh".](/_next/image?url=https%3A%2F%2Fkcbwzropdukwhmmvdylp.supabase.co%2Fstorage%2Fv1%2Fobject%2Fpublic%2Ffrq_stimulus%2Fap-physics-1-revised%2Fabb4b4bf-2d54-4045-b8ef-b27527915ede_fig6.jpg&w=1080&q=75)


