AP Biology Data Analysis FRQ Practice
127 Analyze Data questions written in the AP format. Pick one, read the full question, and write your response.
Your first scored response is included. A plan unlocks unlimited scoring.

127 questions
sorted by unit
Enzyme thermal stability and protein folding mutations
Unit 1: Chemistry of Life
Pectate lyase is an enzyme found in certain bacteria that degrades pectin in plant cell walls. The enzyme's function depends on its tertiary structure, which is maintained by interactions between amino acid R-groups.
Scientists identified a strain of bacteria with a mutation in the gene encoding pectate lyase. The mutation, labeled K128L, results in the substitution of lysine (which has a positively charged R-group) with leucine (which has a nonpolar R-group) at position 128 in the protein chain. To investigate the effect of this mutation, scientists purified both the wild-type (WT) and mutant (K128L) enzymes.
The scientists incubated both enzymes at a range of temperatures from 20°C to 60°C. They measured the relative enzymatic activity of each form (Figure 1A) and used spectroscopy to determine the percent of the protein that remained in its native, folded conformation at each temperature (Figure 1B).
Figure 1. Temperature dependence of wild-type and mutant pectate lyase
Based on Figure 1A, identify the temperature at which the wild-type (WT) enzyme functions at its maximum relative activity.
Based on Figure 1B, describe the difference in the percent of folded protein between the wild-type (WT) and mutant (K128L) enzymes at 40°C.
Scientists hypothesize that the K128L mutation reduces the thermal stability of the enzyme's tertiary structure. Use the data in Figures 1A and 1B to support the scientists' hypothesis.
Based on the chemical properties of the amino acid R-groups provided in the background, explain why the substitution of lysine with leucine results in the structural changes observed in Figure 1B.
What the Data Analysis FRQ asks
This is FRQ 6 on the AP Biology exam. You get data in a graph or table, describe it, use it to evaluate a hypothesis, and explain the biology behind the results.
- 10 min
- suggested writing time
- 4 points
- 1 point for each part
- 50%
- of your score, for all six FRQs
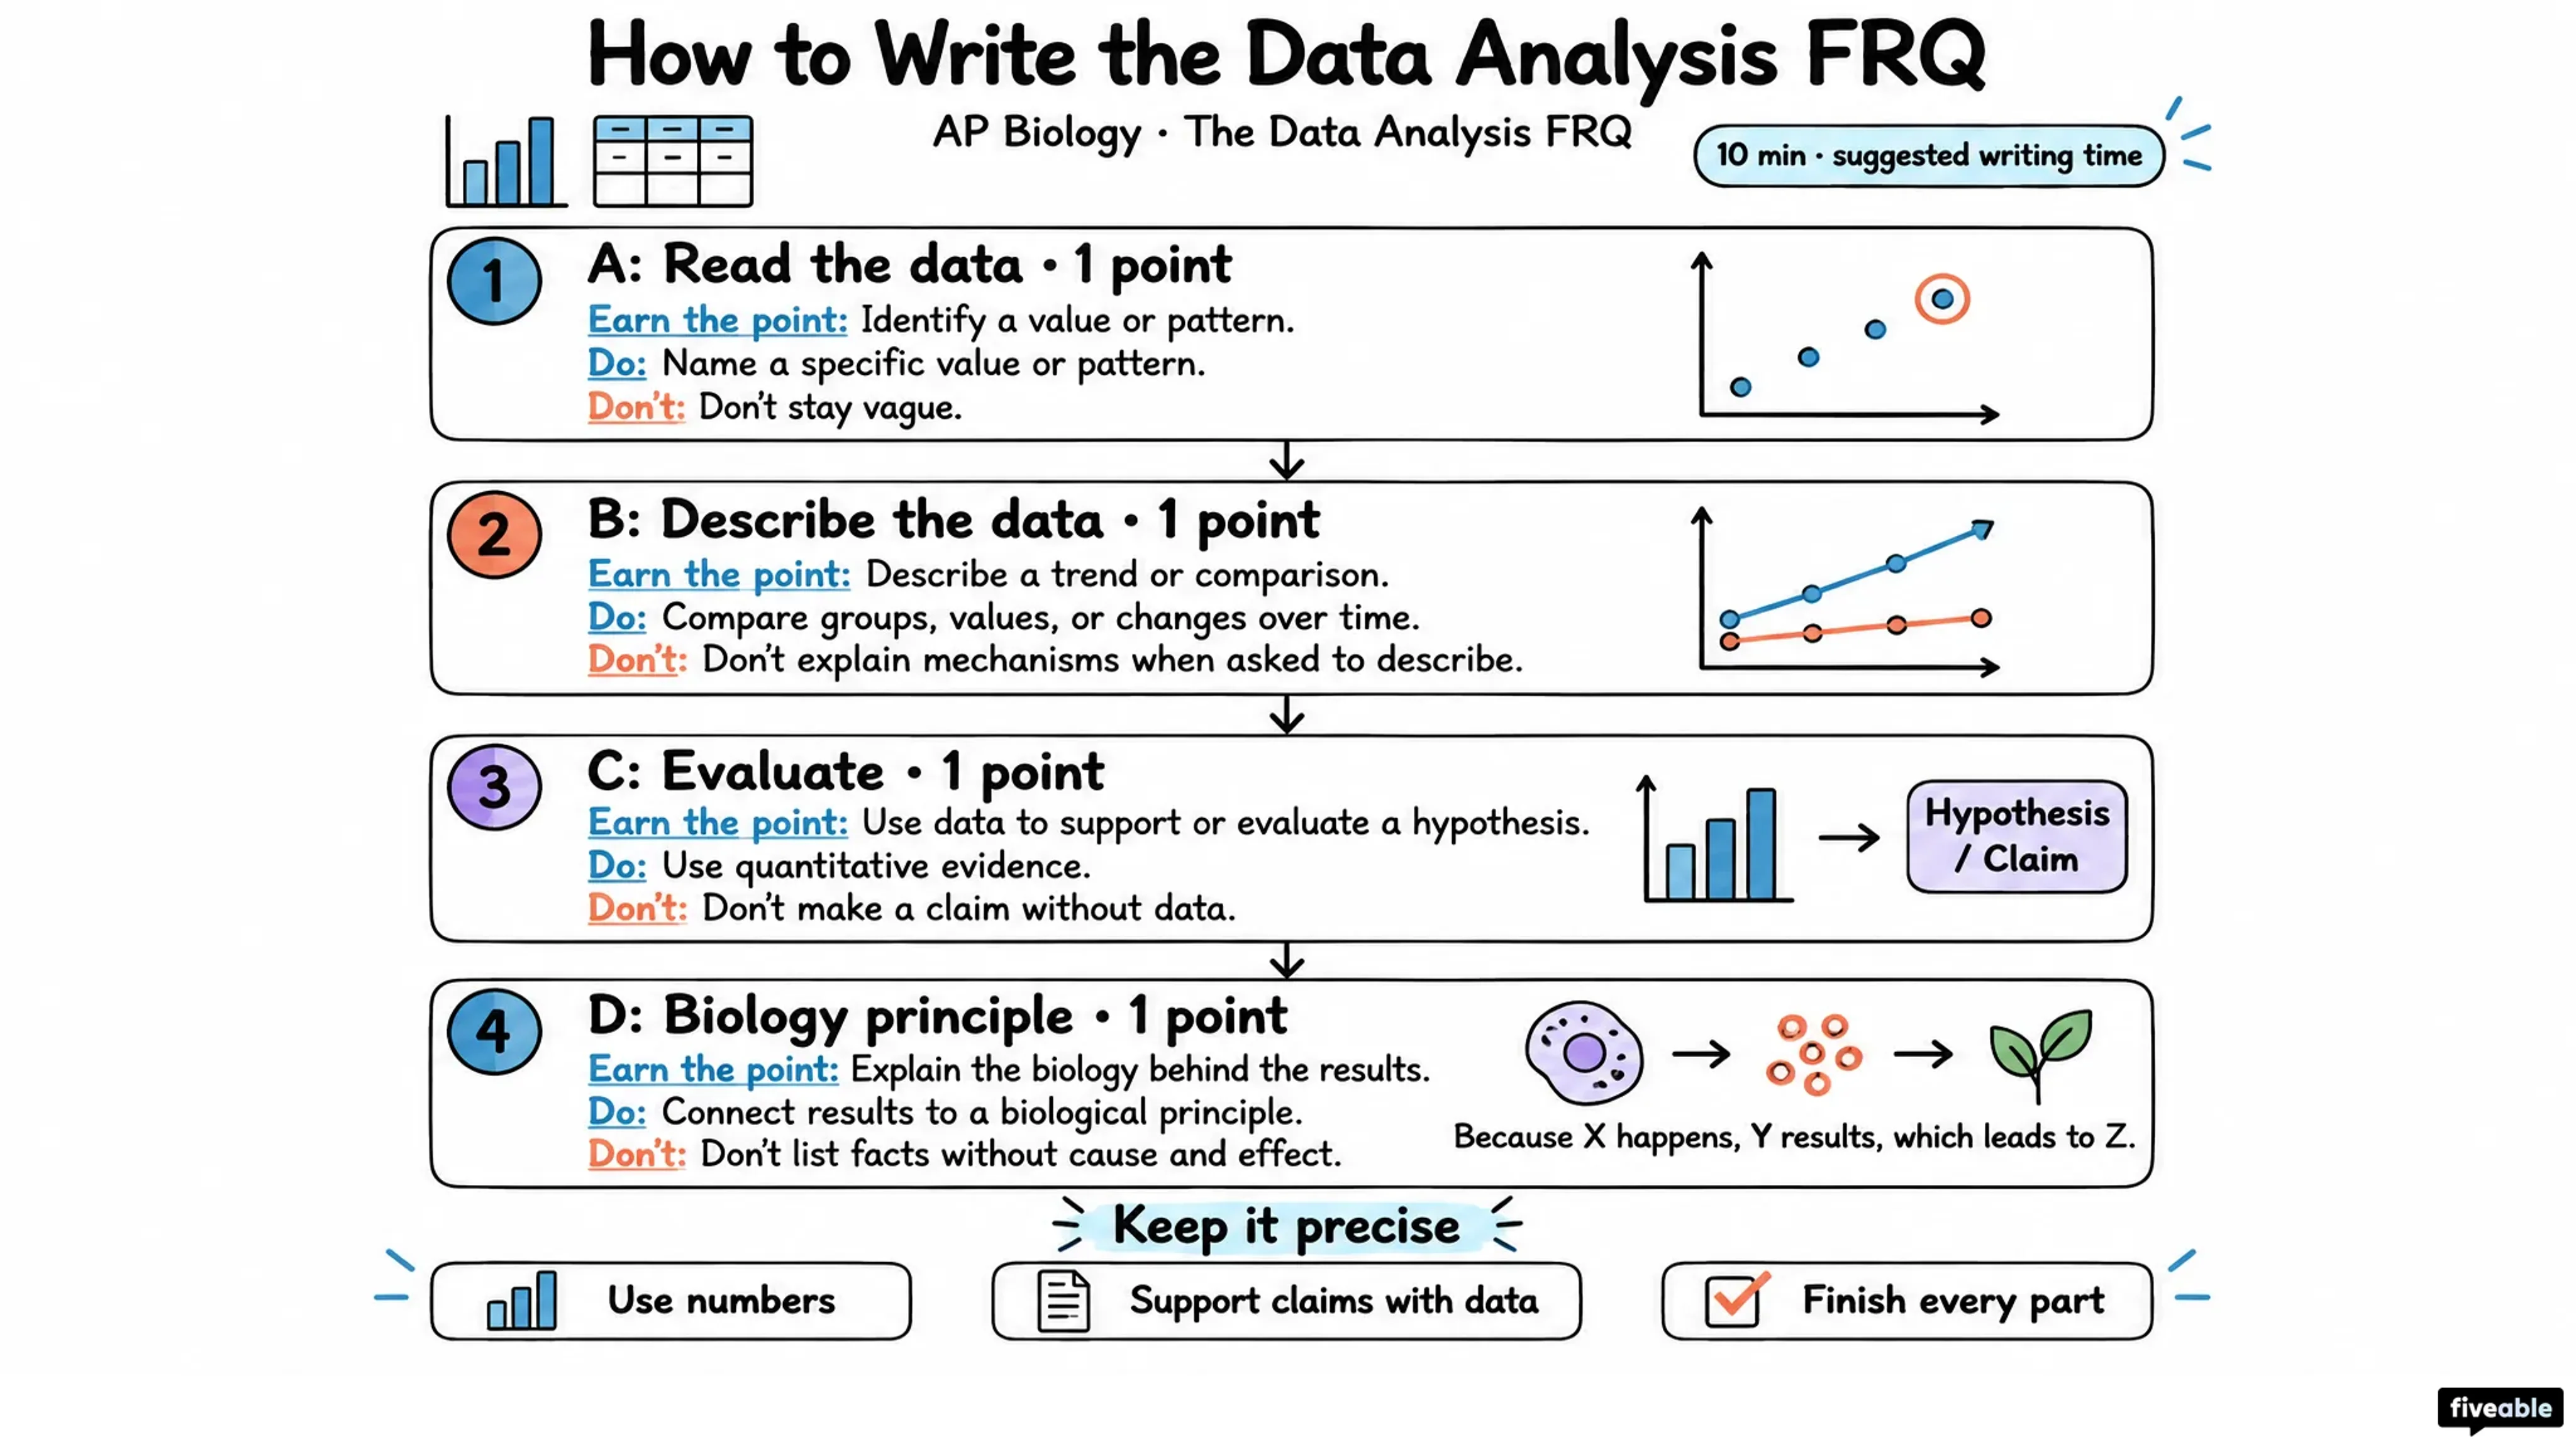
Part A: Read the data
Identify a value or pattern in the data
1 pt
Part B: Describe the data
Describe a trend or comparison
1 pt
Part C: Evaluate
Use the data to support or evaluate a hypothesis
1 pt
Part D: Biology principle
Explain the biology behind the results
1 pt
Data Analysis FRQ skill sheet
Every rubric point on one page: what earns it, what to do and what to avoid. Tap the sheet to see it full size.
How Data Analysis FRQ practice works
Each question follows the exam’s format, from the full prompt to a score on every part.
Read the full question
The data and all four parts, A through D, laid out the way the exam shows them.
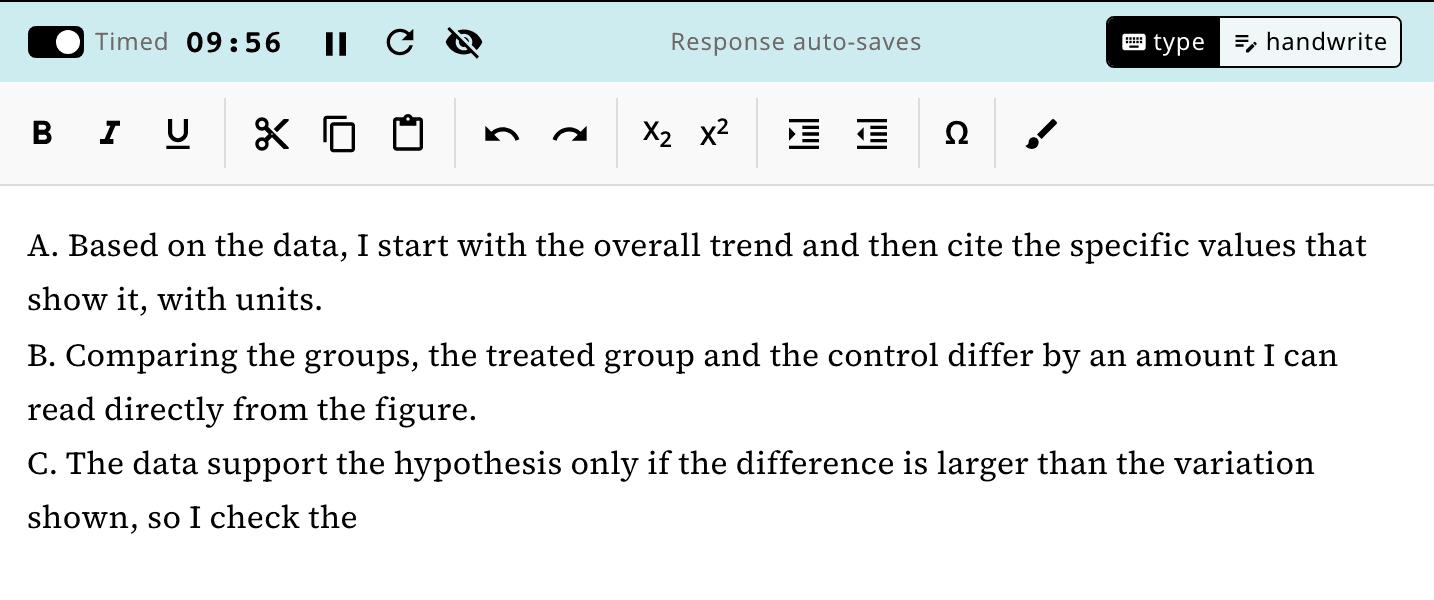
Write on a 10-minute timer
The time to plan for on exam day. Pause it or turn it off, and your response saves as you go.
Submit for a score out of 4
Your response is scored against the scoring guidelines written for that question. Your first score is included.
Feedback on every part
A summary at the top tells you what to work on next. Below it, each part shows whether you earned the point and what the scoring guidelines were looking for.
Detailed Feedback
Part A: 1/1 point
Earned the point. You correctly identified W200L as the mutant strain with water permeability most similar to the wild-type strain.
Part B: 1/1 point
Earned the point. You correctly described the difference in protein abundance, stating that H174A has more AqpZ protein in the membrane than R195V. This demonstrates understanding of the directional difference shown in Figure 1B.
Part C: 0/1 point
Did not earn the point. While you mentioned that R195V has low water permeability, you did not cite the key data from Figure 1B showing that R195V has very low protein amount in the membrane. To earn this point, you needed to explicitly reference the low membrane protein abundance data for R195V, which is the evidence that supports the degradation hypothesis.
What 212 scored Data Analysis FRQs show
Patterns from the practice Data Analysis FRQs students have turned in on Fiveable. Students lose the most points on Part D: biology principle.
A: Read the data
96%
B: Describe the data
86%
C: Evaluate
62%
D: Biology principle
50%
33%
of responses earned all 4 points
2.9 of 4
average score
212 practice responses from 115 students, scored on Fiveable through October 9, 2026.
Questions about the Data Analysis FRQ
How many responses can I get scored?
You can read every question without a plan. Your first scored response is included. A plan unlocks unlimited scoring.
How do I describe data so it earns the point?
Cite specific values and the direction of the change, like “increased from 2 to 5 mm per day.” Saying a value “went up” is usually too vague.
Do I need to calculate anything?
Sometimes, but rarely much. When you do, type your setup and the answer with its units.
How is this different from the Scientific Investigation FRQ?
This question centers on reading results and what they mean. The Scientific Investigation FRQ centers on how the experiment is designed.
More AP Biology practice
Experimental Results FRQ practice
Long FRQs with a research scenario, its figures, and all four parts.
Scientific Investigation FRQ practice
Short FRQs on experimental design, with the scenario and all four parts.
Conceptual Analysis FRQ practice
Short FRQs on a process and a disruption, with all four parts.
Write your first Data Analysis FRQ
Pick one from the list, or let us choose for you.
Teaching AP Biology? Assign these Data Analysis FRQs to your class