AP Biology Graphing FRQ Practice
87 Interpreting and Evaluating Experimental Results with Graphing questions written in the AP format. Pick one, read the full question, and write your response.
Your first scored response is included. A plan unlocks unlimited scoring.
87 questions
sorted by unit
Amino acid R-groups and protein tertiary structure stabilization
Unit 1: Chemistry of Life
Certain bacteria, known as acidophiles, thrive in environments with very low pH, such as acidic sulfur springs. Scientists are investigating the metabolic adaptations of the bacterium Thiobacillus acidophilus, which obtains energy by oxidizing sulfur compounds. The key enzyme in this process is Sulfur Oxidase (SulfurOx).
To investigate the effect of environmental pH on the function of SulfurOx, researchers isolated the enzyme from Thiobacillus acidophilus and measured its activity at various pH levels. The activity was determined by measuring the rate of sulfate (SO4 2-) production, a product of the reaction. The reaction mixtures were maintained at a constant temperature of 30°C. The results, including the standard error of the mean (2SEx), are presented in Table 1.
The oxidation of sulfur by SulfurOx is the first step in a pathway that generates a proton gradient across the bacterial membrane. This gradient is essential for the production of ATP, which powers cellular processes (Figure 2).
Enzymes like SulfurOx are proteins with specific three-dimensional shapes. Describe how the R-groups of amino acids stabilize the tertiary structure of a protein.
Using the template in the space provided for your response, construct an appropriate type of graph that represents the data in Table 1. Your graph should be appropriately plotted and labeled.
Based on the data in Table 1, determine the pH at which the enzyme SulfurOx functions most efficiently.
Table 1. SulfurOx enzyme activity across pH conditions
Figure 2. Spatial model of sulfur oxidation in Thiobacillus acidophilus
Based on Table 1, identify the pH level at which the enzyme activity is less than 50% of the maximum observed activity.
Based on Figure 2, predict the effect of a chemical inhibitor that blocks the active site of SulfurOx on the amount of ATP produced by the bacterium.
Industrial mining operations often produce acidic runoff containing high levels of sulfur. Scientists claim that introducing Thiobacillus acidophilus to these runoff sites can help remediate the environment by consuming the sulfur, provided the pH remains within the organism's optimal physiological range.
Use evidence from the information provided to support the scientists' claim that Thiobacillus acidophilus is physiologically adapted to function best in acidic environments.
Based on Figure 2, explain how a mutation that prevents the hydrolysis of ATP would affect the growth of Thiobacillus acidophilus.
What the Graphing FRQ asks
This is FRQ 2 on the AP Biology exam, one of the two long FRQs. You get a research scenario with a data table, build a graph from the data, and answer parts about the results and the researchers’ claims.
- 25 min
- suggested writing time
- 9 points
- across parts A to D
- 50%
- of your score, for all six FRQs
Part A: Biology concept
Describe a concept or process behind the experiment
1 pt
Part B: Graph
Construct, plot, and label a graph from the data table, then read a result
4 pts
Part C: Data analysis
Identify a value in the data and predict an effect
2 pts
Part D: Claims
Support a claim with evidence and explain a result
2 pts
How Graphing FRQ practice works
Each question follows the exam’s format, from the full prompt to a score on every part.
Read the full question
The research scenario, the data table, and all four parts, A through D, laid out the way the exam shows them.
Write on a 25-minute timer
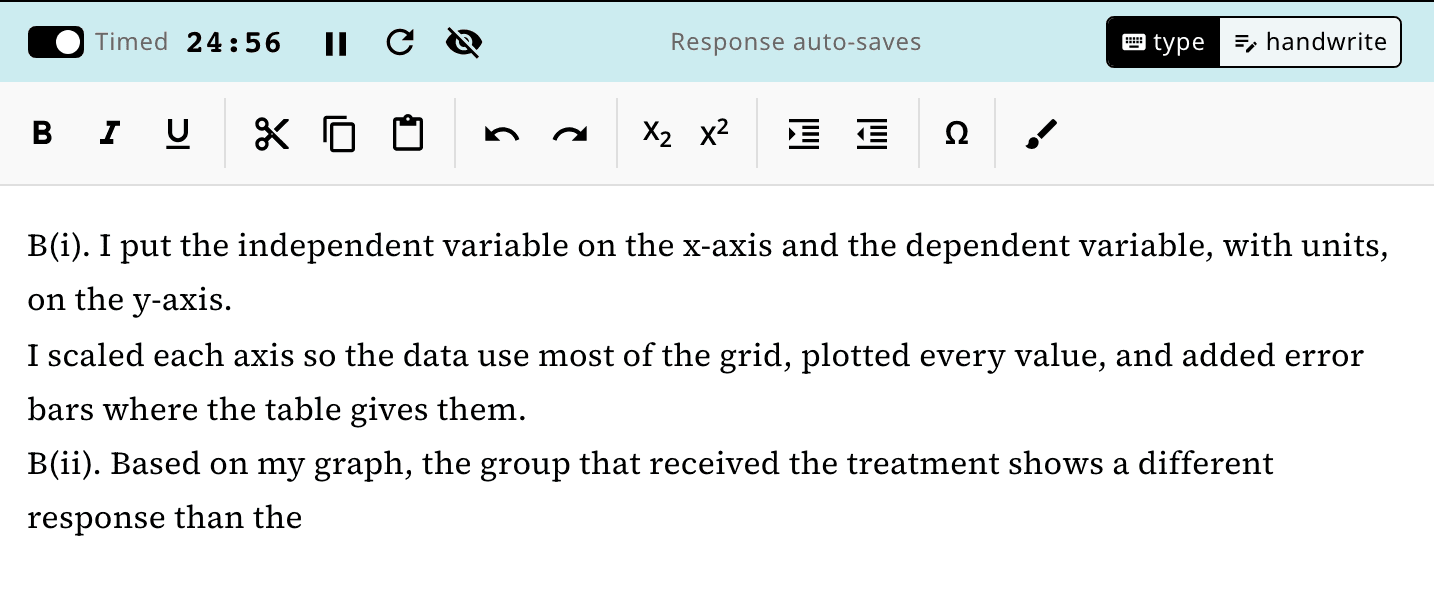
The time to plan for on exam day. Pause it or turn it off, and your response saves as you go.
Submit for a score out of 9
Your response is scored against the scoring guidelines written for that question. Your first score is included.
Feedback on every part
A summary at the top tells you what to work on next. Below it, each part shows whether you earned the point and what the scoring guidelines were looking for.
Detailed Feedback
Part A: 0/1 point
Did not earn the point. You described RNA polymerase as unwinding DNA and proofreading RNA, but you didn't explain its core role in transcription — synthesizing RNA by linking nucleotides together using the DNA template. To earn this point, you needed to say that RNA polymerase builds or assembles an RNA strand by adding/linking RNA nucleotides based on the DNA template.
Part B: 1/1 point
Earned the point. You used a bar graph to display the data, which is the correct graph type for this categorical data.
Part B: 1/1 point
Earned the point. You correctly identified that the mutant yeast strain (ΔHSF1) will not respond to heat stress, which shows you understand that the HSF1 mutation eliminates the ability to upregulate HSP12 mRNA in response to increased temperature.
Questions about the Graphing FRQ
How many responses can I get scored?
You can read every question without a plan. Your first scored response is included. A plan unlocks unlimited scoring.
How do I make the graph?
Use the drawing tool, which can add axes and a grid, or switch the editor to handwrite, draw your graph on paper, and add a photo of your page.
What makes a graph earn its points?
The right type for the data, labeled axes with units, a scale that uses the grid, and accurately plotted values. Bar graphs fit categories and line graphs fit continuous data.
How is FRQ 2 different from FRQ 1?
Both give you an experiment with data and the same four parts. FRQ 2 asks you to build the graph yourself. FRQ 1 gives you figures to read.
Do I have to write in complete sentences?
Yes. On the exam, outlines and bulleted lists alone aren’t scored, so write each part in full sentences.
More AP Biology practice
Experimental Results FRQ practice
Long FRQs with a research scenario, its figures, and all four parts.
Scientific Investigation FRQ practice
Short FRQs on experimental design, with the scenario and all four parts.
Conceptual Analysis FRQ practice
Short FRQs on a process and a disruption, with all four parts.
Data Analysis FRQ practice
Short FRQs with a graph or table of results and all four parts.
Write your first Graphing FRQ
Pick one from the list, or let us choose for you.
Teaching AP Biology? Assign these Graphing FRQs to your class