Corporate finance decisions shape a firm's value through strategic resource allocation and risk management. Understanding key principles like time value of money and agency theory helps managers make informed choices that balance shareholder interests with long-term growth.
Capital structure, dividend policy, and investment evaluation methods are the main tools for maximizing firm value. By optimizing the mix of debt and equity, managing dividend payouts, and using NPV and IRR to assess projects, companies can strengthen their financial performance and market position.
Corporate Finance Principles and Firm Value
Maximizing Shareholder Value and Time Value of Money
The central goal of corporate finance is to maximize shareholder value through effective financial decision-making and resource allocation. Every major decision a firm makes, from which projects to fund to how to raise capital, should be evaluated against this goal.
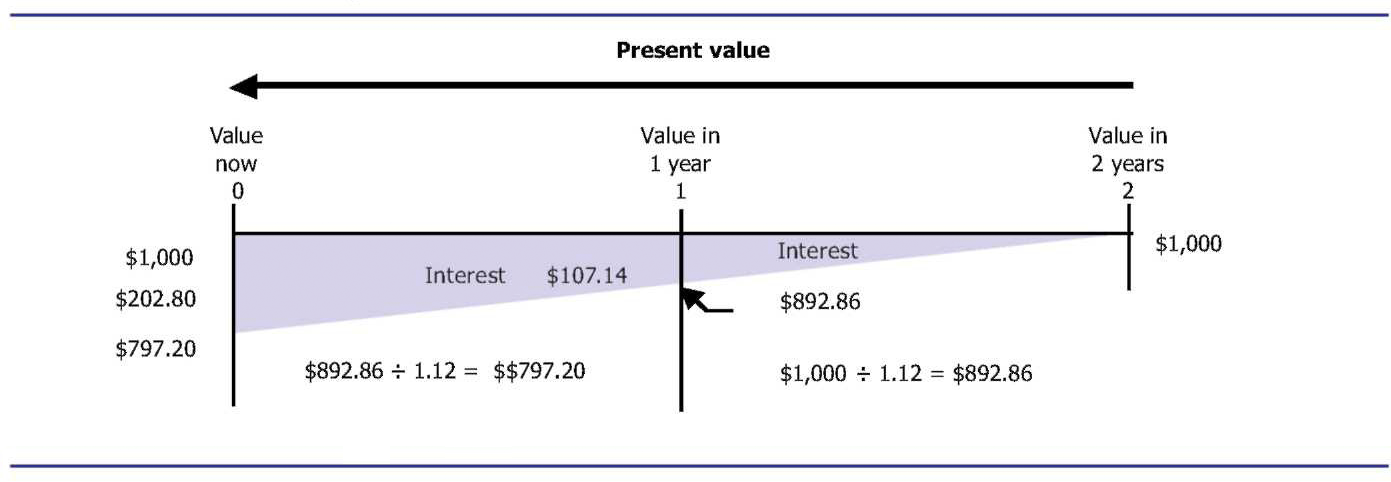
The time value of money is the foundational principle behind most of corporate finance. A dollar today is worth more than a dollar in the future because you can invest that dollar and earn a return on it.
- Example: invested today at 5% interest becomes in one year. That future dollar is "discounted" back to its present value in financial calculations.
The risk-return tradeoff is the other side of the coin: higher potential returns come with greater risk.
- Investing in a tech startup carries high risk but high potential return, while government bonds offer low risk and low return. Rational investors demand compensation (higher expected returns) for taking on more risk.
Agency Theory and Market Efficiency
Agency theory examines conflicts of interest between shareholders (the principals) and managers (the agents). Shareholders want managers to maximize firm value, but managers have their own incentives that don't always align.
- Example: A manager might prioritize short-term profits to boost their annual bonus, even if that means underinvesting in R&D that would create more long-term value for shareholders.
- Solutions include performance-based compensation, board oversight, and tying executive pay to stock performance.
The efficient market hypothesis (EMH) suggests that stock prices reflect available information, which influences how firms communicate with the market and time their financial decisions. It comes in three forms:
- Weak form: Prices reflect all past price and trading data
- Semi-strong form: Prices reflect all publicly available information (financial statements, news, analyst reports)
- Strong form: Prices reflect all information, including insider information
If markets are at least semi-strong efficient, firms can't easily "time" stock issuances to exploit mispricing, and financial disclosures get incorporated into prices quickly.
Capital Budgeting and Corporate Governance
Capital budgeting is the process of evaluating and selecting long-term investment projects that maximize firm value. This is where the time value of money gets put to practical use.
The capital budgeting process follows these steps:
- Identify investment opportunities
- Estimate expected future cash flows for each project
- Assess the risk associated with those cash flows
- Calculate project value using methods like NPV or IRR (covered below)
- Make the investment decision based on the analysis
Corporate governance structures exist to keep management decisions aligned with shareholder interests. Key components include:
- Board of directors that monitors and advises management
- Shareholder rights such as voting on major decisions
- Transparency and disclosure requirements
- Executive compensation policies designed to align incentives
Weak governance tends to worsen agency problems, while strong governance helps ensure that financial decisions actually serve shareholder value.
Capital Structure Decisions

Modigliani-Miller Theorem and Trade-off Theory
Capital structure refers to the specific mix of debt and equity a company uses to finance its operations and investments. Getting this mix right matters because it affects the firm's cost of capital and overall value.
The Modigliani-Miller (M&M) theorem is the theoretical starting point. Under perfect market conditions, M&M says capital structure is irrelevant to firm value. The key assumptions are:
- No taxes
- No transaction costs
- No bankruptcy costs
- Perfect information
These assumptions obviously don't hold in the real world, but M&M is useful because it tells you why capital structure matters: it matters precisely because of taxes, bankruptcy costs, and information asymmetries.
The trade-off theory builds on M&M by recognizing that debt creates a tax shield (interest payments are tax-deductible) but also increases the risk of financial distress. Firms should increase debt up to the point where the marginal tax benefit equals the marginal cost of potential bankruptcy.
- Example: A company might target a 40% debt-to-equity ratio to capture meaningful tax benefits while keeping bankruptcy risk manageable.
Pecking Order Theory and Cost of Capital
The pecking order theory takes a different approach. Rather than targeting an optimal ratio, it says firms prefer financing sources that involve the least information asymmetry. The hierarchy is:
- Internal funds (retained earnings) — no external scrutiny needed
- Debt — requires some disclosure but less than equity
- Equity — signals to the market that management may think shares are overvalued, so it's the last resort
The weighted average cost of capital (WACC) represents the blended cost of all financing sources. It's the discount rate firms use to evaluate new projects.
Where:
- = Market value of equity
- = Market value of debt
- = Total market value ()
- = Cost of equity
- = Cost of debt
- = Corporate tax rate
The term on the debt side reflects the tax deductibility of interest. This is why debt is typically cheaper than equity on an after-tax basis.
Financial Leverage and Operating Leverage
Financial leverage measures how much a firm relies on debt to finance its assets. The most common metric is the debt-to-equity ratio:
Two related measures capture how sensitive a firm's earnings are to changes in business conditions:
- Degree of operating leverage (DOL) measures how a change in sales affects operating income (EBIT). Firms with high fixed costs have high DOL.
- Degree of financial leverage (DFL) measures how a change in EBIT affects earnings per share. Firms with more debt have higher DFL.
A company with both high fixed costs (high DOL) and high debt (high DFL) will experience amplified earnings volatility. A small swing in sales gets magnified into a much larger swing in EPS, which increases risk for shareholders.
Dividend Policy and Firm Value
Dividend Theories and Signaling
Dividend policy determines how much of a firm's earnings get distributed to shareholders versus retained for reinvestment. Several competing theories explain how this affects firm value:
- Dividend irrelevance theory (Miller and Modigliani): Under perfect market conditions, dividend policy doesn't affect firm value. Investors can create their own "dividends" by selling shares if they want cash.
- Bird-in-hand theory: Investors prefer the certainty of dividend payments over uncertain future capital gains, so higher dividends increase firm value.
- Tax preference theory: Investors may actually prefer lower dividends because capital gains are often taxed at lower rates than dividend income. Under this view, firms that retain more earnings create more value.
Signaling theory adds another dimension: changes in dividend policy convey information about management's view of the firm's future.
- A dividend increase often signals management's confidence in sustained future earnings.
- A dividend cut can signal financial trouble, which is why firms are reluctant to reduce dividends even when cash is tight.
Share Repurchases and Residual Dividend Policy
Share repurchases (buybacks) are an alternative to cash dividends for returning cash to shareholders. They offer more flexibility because a firm isn't locked into a recurring payment, and they can be more tax-efficient since shareholders choose whether to sell.
Common repurchase methods:
- Open market repurchases: The firm buys shares gradually on the open market (most common)
- Tender offers: The firm offers to buy a set number of shares at a specified price
- Dutch auctions: Shareholders specify the lowest price at which they'd sell, and the firm buys at the lowest price that fills its target quantity
The residual dividend policy ties dividends directly to investment needs:
- Determine the optimal capital budget (which positive-NPV projects to fund)
- Identify the target capital structure (the ideal debt/equity mix)
- Use retained earnings to fund the equity portion of new investments
- Pay dividends only from whatever funds remain
This approach prioritizes investment over payouts, which makes theoretical sense but can lead to volatile dividend payments that some investors dislike.
Investment Project Evaluation: NPV vs IRR
Net Present Value (NPV) Method
NPV calculates the present value of all expected future cash flows from a project, minus the initial investment. It directly measures how much value a project adds to the firm.
Where:
- = Cash flow at time
- = Discount rate (typically WACC)
- = Initial investment
The decision rule is straightforward: accept projects with a positive NPV, reject those with a negative NPV.
- Example: Project A has an NPV of , so it should be accepted because it adds value. Project B has an NPV of , so it should be rejected because it destroys value.
NPV is generally considered the most reliable evaluation method because it directly measures value creation in dollar terms.
Internal Rate of Return (IRR) Method
IRR is the discount rate that makes a project's NPV exactly equal to zero. Think of it as the project's "breakeven" rate of return.
The decision rule: accept projects where the IRR exceeds the required rate of return (cost of capital).
- Example: If the cost of capital is 10% and a project's IRR is 15%, the project earns more than it costs to finance, so it should be accepted.
IRR is intuitive because it expresses returns as a percentage, which managers find easy to compare. But it has some important limitations.
Comparing NPV and IRR
NPV and IRR usually agree on standalone projects, but they can give conflicting recommendations for mutually exclusive projects (where you can only pick one) or projects with non-conventional cash flows (where cash flows switch between positive and negative multiple times).
- Example: Project X has an NPV of and an IRR of 20%. Project Y has an NPV of and an IRR of 18%. IRR favors X, but NPV favors Y. Since NPV directly measures value added, NPV should take priority when the two methods conflict.
The modified internal rate of return (MIRR) addresses a key IRR limitation: the standard IRR assumes cash flows are reinvested at the IRR itself, which is often unrealistic. MIRR instead assumes reinvestment at the cost of capital.
Sensitivity analysis and scenario analysis complement both methods by testing how results change when key assumptions shift. For example, you might calculate a project's NPV under optimistic, most likely, and pessimistic sales growth scenarios to understand the range of possible outcomes and the project's risk profile.