🗺️Intro to World Geography Unit 1 Review
1.3 Geographic Tools and Technology
1.3 Geographic Tools and Technology
Unit & Topic Study Guides
Introduction to Geography
Earth's Physical Systems
Human-Environment Interaction
Population and Migration
Cultural Geography
Political Geography
Economic Geography
Urban Geography
Regional Geography: The Americas
Europe and Russia: Regional Geography
Africa and Middle East: Regional Geography
Asia and Oceania: Regional Geography
Geographers' Essential Tools
Geographic tools and technology form the foundation of how geographers study the world. From paper maps to satellite imagery, these tools let us collect, visualize, and interpret spatial data to reveal patterns we couldn't see otherwise. Understanding what each tool does and when to use it is a core part of introductory geography.
Cartographic Representations
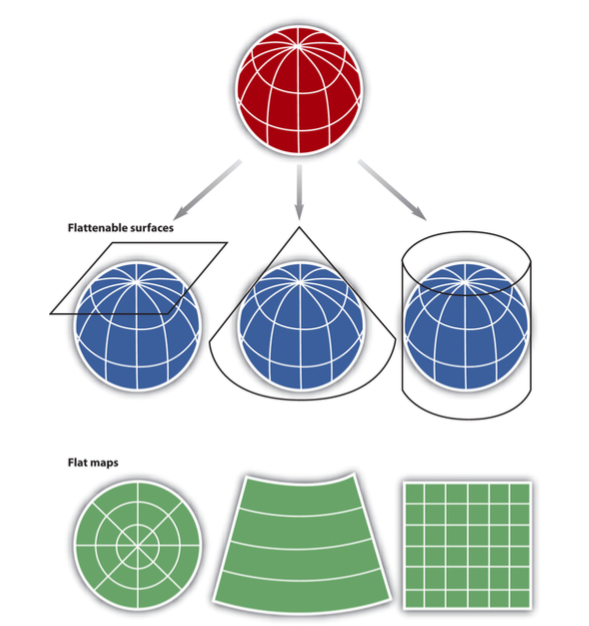
Maps are flat (2D) depictions of Earth's surface. Because you can't perfectly flatten a sphere, every map uses a projection, which is a method for translating the 3D Earth onto a 2D surface. Every projection involves trade-offs.
- Mercator projection preserves shapes and angles, making it great for navigation. The trade-off: it distorts size, especially near the poles. Greenland looks as big as Africa on a Mercator map, even though Africa is about 14 times larger.
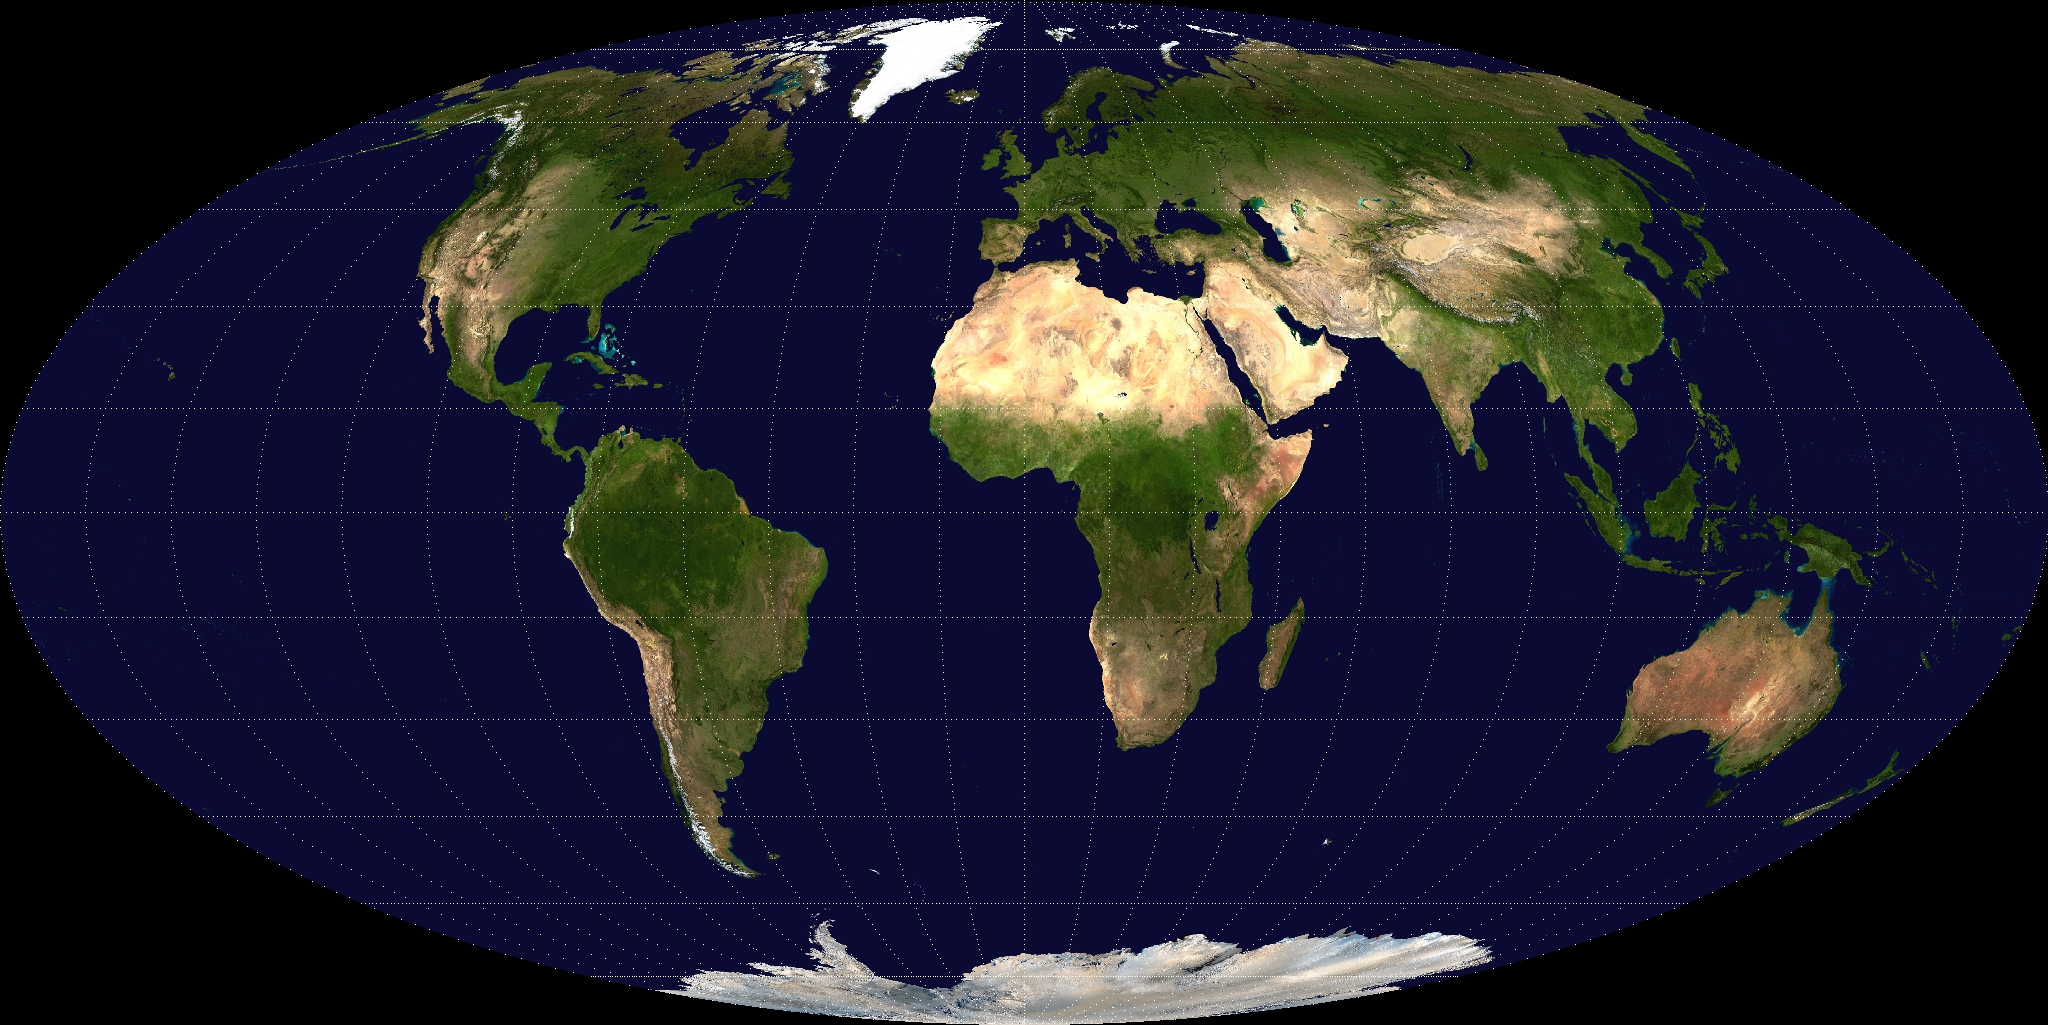
- Equal-area projections (like the Mollweide) keep area relationships accurate, so continent sizes look correct relative to each other. The trade-off: shapes get distorted, especially at the edges.
Globes are 3D models of Earth that avoid projection distortions entirely. They show true relative sizes and positions of continents. The downside is practical: you can't zoom into street-level detail on a physical globe, and they're not easy to carry around.
Traditional surveying tools help geographers measure and represent surface features accurately:
- Compasses determine direction using Earth's magnetic field
- Theodolites measure horizontal and vertical angles for land surveying
- Total stations combine distance and angle measurements into one instrument, making field surveys faster and more precise
Digital Geographic Technologies
Geographic Information Systems (GIS) are software platforms that capture, store, analyze, and display spatial data. Think of GIS as a system that stacks different data layers on top of each other. One layer might show roads, another shows elevation, and another shows population density. By combining layers, you can answer questions like Where should we build a new hospital to serve the most people? or Which neighborhoods face the highest flood risk? Common GIS software includes ArcGIS and QGIS.
Global Positioning System (GPS) uses a network of satellites orbiting Earth to pinpoint your exact location. A GPS receiver picks up signals from multiple satellites and calculates your latitude, longitude, and altitude. It's the technology behind phone navigation, but geographers also use GPS receivers to collect precise field data for mapping.
Digital Elevation Models (DEMs) represent terrain in 3D. They're created using remote sensing techniques like LIDAR or radar, and they let geographers analyze slope, drainage patterns, and landforms without physically walking the terrain.
3D mapping software like Google Earth lets you explore satellite imagery draped over terrain models. These tools make geographic data more intuitive by letting you "fly" over landscapes and see how features relate to each other spatially.
Remote Sensing in Geographic Research
Remote sensing means collecting information about Earth's surface from a distance, usually from satellites or aircraft. Instead of going to a location to study it, you analyze data captured from above.
Satellite-Based Remote Sensing
Satellites provide large-scale imagery of Earth's surface, and different types of sensors capture different kinds of information:
- Standard satellite imagery gives us visual data of the surface. The Landsat program has provided continuous global coverage since 1972, creating one of the longest records of Earth's changing surface.
- Multispectral imaging captures data across several wavelength bands, including wavelengths our eyes can't see. For example, healthy vegetation reflects a lot of near-infrared light, so geographers use near-infrared data to assess crop health or detect stressed forests.
- Thermal infrared sensors detect heat rather than visible light. These are used to study urban heat islands (cities that are significantly warmer than surrounding rural areas) and to monitor volcanic activity.
Advanced Remote Sensing Technologies
- LIDAR (Light Detection and Ranging) fires rapid laser pulses toward the ground and measures how long each pulse takes to bounce back. This creates extremely detailed 3D models of terrain and vegetation. LIDAR can even map the ground surface beneath a forest canopy.
- Radar systems (like Synthetic Aperture Radar, or SAR) can see through clouds and darkness, making them useful in regions with persistent cloud cover. Radar can also detect tiny changes in ground elevation, which helps scientists monitor earthquake zones and volcanic areas.
- Drones (UAVs) collect high-resolution imagery of small areas on demand. They're increasingly used in agriculture, disaster response, and environmental monitoring because they're cheaper and more flexible than satellites for local-scale work.
Geospatial Technologies for Data Analysis
Data Collection and Management
Geographers gather spatial data from many sources:
- GPS field surveys capture precise locations of infrastructure, natural features, or research sites
- Aerial photography from aircraft provides detailed imagery useful for urban planning, agriculture, and forestry
- Crowd-sourced geographic data comes from public contributions. OpenStreetMap, for example, lets anyone map and edit geographic features, creating a free, detailed world map built by volunteers. Citizen science projects similarly collect environmental data like bird counts or water quality readings.
- Geospatial databases store and organize all this location-based information so it can be efficiently searched and analyzed
Advanced Analysis Techniques
GIS enables several powerful types of spatial analysis:
- Overlay analysis combines multiple data layers to answer questions. For example, overlaying flood zone maps with property value data shows which areas face the greatest economic risk from flooding.
- Buffer analysis creates zones of a set distance around features. A city might draw a 100-meter buffer around every wetland to define protection areas where building is restricted.
- Network analysis finds optimal routes or service areas, like determining the fastest ambulance route to a hospital.
At more advanced levels, geographers also use large datasets and computational tools. Satellite imagery collected over many years can reveal land use changes, like the spread of urban areas into farmland. Cloud-based platforms like Google Earth Engine give researchers access to massive archives of satellite data along with the processing power to analyze them.
Analyzing Spatial Information
Thematic Mapping and Visualization
Thematic maps display specific geographic phenomena rather than just showing physical features. The type of map you choose depends on what you're trying to communicate:
- Choropleth maps shade regions (like counties or countries) based on data values. A choropleth map of population density, for instance, would shade densely populated counties darker and sparsely populated ones lighter.
- Dot density maps place dots to represent quantities. Each dot might represent 1,000 people, so clusters of dots show where population concentrates.
- Proportional symbol maps use symbols (usually circles) scaled to data values. A larger circle over New York City and a smaller one over Des Moines immediately communicates the population difference.
3D visualizations and interactive web maps take this further by letting users explore data dynamically, toggling layers on and off, zooming in, and clicking features for more information.
Applied Spatial Analysis
These tools come together in real-world applications:
- Environmental monitoring: Comparing satellite images over time reveals deforestation rates in places like the Amazon, or tracks how urban areas expand into agricultural land.
- Land cover classification: Remote sensing data helps map crop types for agricultural monitoring or measure how much of an urban area is covered by impervious surfaces like pavement and rooftops (which affects flooding and water quality).
- Scenario modeling: Geographers can model outcomes under different conditions. For example, How far would floodwaters spread if rainfall doubled? or Which areas provide the best habitat for an endangered species based on elevation, vegetation, and water access?
- Field data integration: GPS data collected in the field can be combined with existing databases. Researchers might map locations of invasive species and then analyze how quickly they're spreading, or record archaeological sites and link them to databases of artifacts found there.