GIS applications in landscape analysis give geomorphologists the ability to map, measure, and model landforms with high spatial precision. By layering multiple datasets in a single environment, GIS transforms raw spatial data into quantitative insights about surface processes. This topic covers the core GIS workflows, analytical techniques, remote sensing integration, and applied hazard assessment used in modern geomorphological research.
GIS for Geomorphological Analysis
Fundamentals of GIS in Geomorphology
A Geographic Information System (GIS) stores, manages, analyzes, and visualizes spatial data tied to geomorphological features and processes. Its real power comes from integration: you can stack data layers for topography, geology, hydrology, and land cover into a single comprehensive landscape model, then query relationships between them.
Core capabilities include:
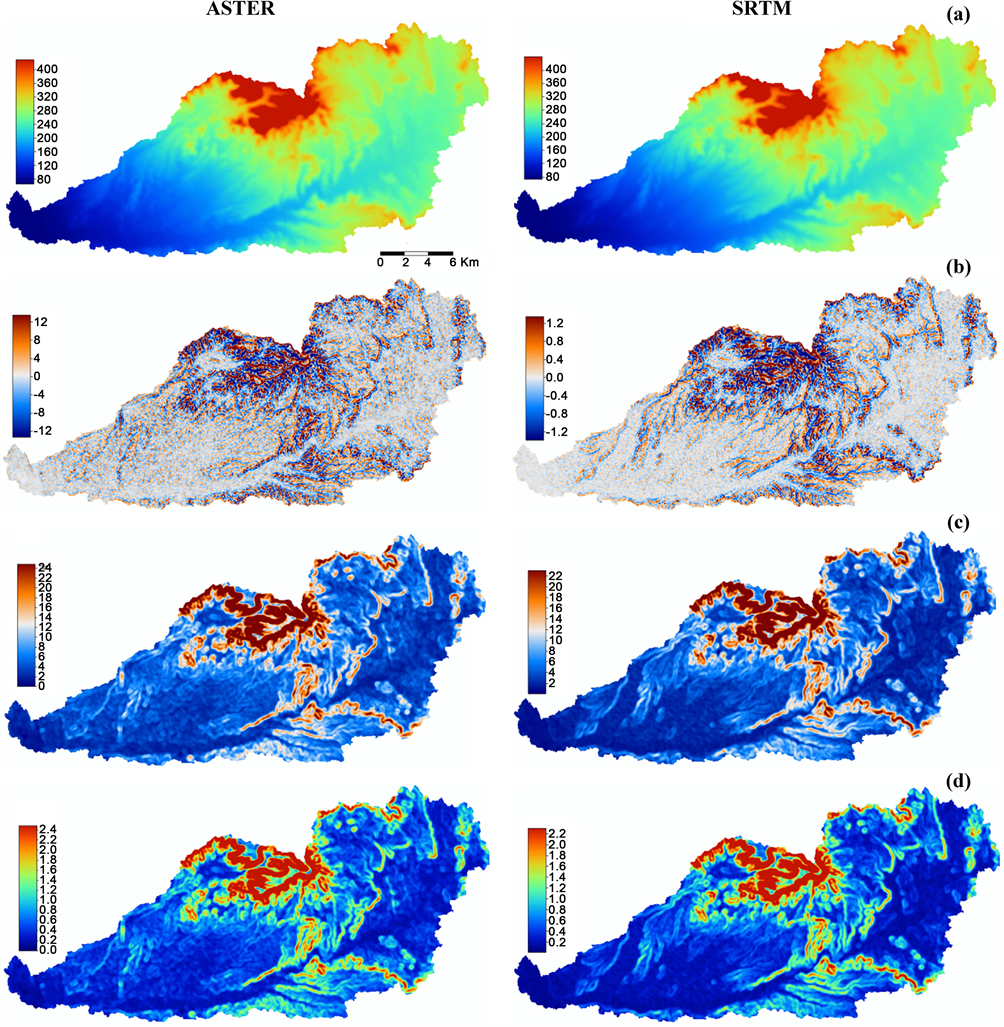
- Creating high-resolution Digital Elevation Models (DEMs) and derived products like slope maps, aspect maps, and curvature maps
- Visualizing complex geomorphological data in both 2D and 3D, which makes interpretation and communication far more effective
- Running temporal analyses to track landscape changes over time, such as erosion rates, sediment transport volumes, and landform development
Advanced GIS Techniques for Landscape Analysis
Beyond basic mapping, GIS supports quantitative study of landforms through several categories of spatial analysis:
Terrain and watershed analysis includes watershed delineation (automatically defining drainage basins from a DEM), slope stability assessment, and morphometric characterization of landforms.
Geostatistical methods let you predict values at unsampled locations and detect spatial patterns:
- Kriging uses statistical models of spatial correlation to produce best-estimate surfaces with uncertainty measures
- Inverse Distance Weighting (IDW) estimates values based on proximity to known points, with closer points weighted more heavily
- Spatial autocorrelation statistics like Moran's I and Getis-Ord G* identify whether geomorphological features cluster, disperse, or distribute randomly
Interpolation methods improve how you model continuous surfaces from point data. Spline interpolation produces smooth surfaces and works well for gently varying terrain, while natural neighbor interpolation handles irregularly spaced point data without requiring you to set search parameters.
GIS Techniques in Geomorphology
Data Preparation and Management
Before any analysis, geospatial data needs to be cleaned and organized. This preparation phase matters because errors here propagate through every downstream result.
Key preprocessing steps:
- Georeferencing aligns spatial data to a known coordinate system so that different datasets overlay correctly
- Coordinate system transformation ensures compatibility when combining data from different sources (e.g., converting between UTM zones or from geographic to projected coordinates)
- Data cleaning removes errors, fills gaps, and resolves inconsistencies in attribute tables or geometry
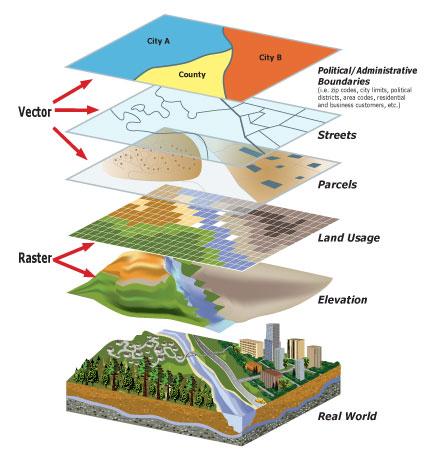
GIS represents geomorphological features using two fundamental data models:
- Vector data (points, lines, polygons) represents discrete features like river channels, ridgelines, or mapped landslide boundaries
- Raster data represents continuous surfaces as grids of cells, each holding a value. Elevation, slope, and land cover are typical raster datasets
For large projects, spatial database management systems (geodatabases) organize both spatial geometry and attribute data together. Spatial indexing within these databases dramatically speeds up queries on large datasets.
Analytical Tools and Techniques
Terrain analysis tools quantify landform characteristics directly from DEMs:
- Hillshade simulates illumination from a light source to visualize topographic relief and reveal subtle surface features
- Contour mapping connects points of equal elevation to represent terrain shape
- Hypsometric analysis plots the distribution of elevation within a basin, which helps evaluate what stage of landscape evolution a watershed is in (young, mature, or old)
Hydrological modeling reconstructs drainage patterns from elevation data in a logical sequence:
- Calculate flow direction for each cell (which neighboring cell would water flow to?)
- Run flow accumulation to count how many upstream cells drain through each point, revealing potential stream networks
- Use accumulation thresholds and pour points to delineate watersheds that define drainage basin boundaries
Multi-criteria decision analysis (MCDA) combines multiple spatial factors into a single assessment. Weighted overlay analysis, for example, stacks reclassified layers (slope, soil type, land cover) with user-defined weights to produce suitability or susceptibility maps. The Analytical Hierarchy Process (AHP) provides a structured method for assigning those weights by comparing factors pairwise.
Spatial statistics and geoprocessing round out the analytical toolkit:
- Cluster analysis (hot spot analysis) identifies statistically significant spatial concentrations of features
- Buffer analysis creates distance zones around features for proximity studies
- Overlay analysis combines multiple layers through operations like intersection, union, or erase
Remote Sensing and GIS Integration
Remote Sensing Data Sources and Processing
Remote sensing feeds GIS with the raw observations that drive geomorphological analysis. The main data sources each serve different purposes:
- Satellite imagery (Landsat at 30 m resolution, Sentinel-2 at 10 m) covers broad areas and is ideal for regional-scale landscape mapping with repeat coverage
- Aerial photographs provide higher resolution for local studies and, when collected over decades, offer a historical record of landscape change
- LiDAR (Light Detection and Ranging) uses laser pulses to measure surface elevation with centimeter-level vertical accuracy, making it the gold standard for precise terrain modeling
To extract useful information from imagery, image classification assigns land cover or landform categories to pixels:
- Supervised classification requires you to define training areas for each class, then the algorithm assigns remaining pixels based on spectral similarity
- Unsupervised classification groups pixels into clusters automatically based on spectral properties, which you then label
- Object-based image analysis (OBIA) segments the image into meaningful objects first, then classifies those objects using shape, texture, and context in addition to spectral values
Multispectral and hyperspectral imagery add further analytical depth. Vegetation indices like NDVI (Normalized Difference Vegetation Index) use the ratio of near-infrared to red reflectance to map plant health and distribution. Spectral unmixing decomposes mixed pixels to estimate the proportion of different surface materials within a single cell.
Advanced Remote Sensing and GIS Fusion
LiDAR integration is particularly valuable because it produces multiple elevation products from a single dataset:
- Digital Surface Models (DSMs) represent the top of all surface features, including buildings and vegetation canopy
- Digital Terrain Models (DTMs) represent bare-earth topography with vegetation and structures filtered out
- The difference between DSM and DTM yields a canopy height model, useful for analyzing vegetation structure and its influence on surface processes
Change detection monitors landscape evolution by comparing datasets from different times:
- Post-classification comparison detects categorical changes (e.g., forest converted to bare soil after a landslide)
- Image differencing on continuous variables (elevation surfaces, vegetation indices) quantifies how much change occurred and where
Optical-radar fusion combines complementary strengths. Optical sensors capture spectral information for visual interpretation and land cover mapping, while synthetic aperture radar (SAR) penetrates clouds and provides data on surface roughness and soil moisture content.
Photogrammetric techniques within GIS create 3D landscape models from overlapping imagery. Structure from Motion (SfM) reconstructs 3D surfaces from multiple photographs taken at different angles, often from drones. Stereo image processing of aerial photograph pairs also generates DEMs, though typically at lower resolution than LiDAR.
GIS Applications in Geomorphology
Geomorphological Hazard Assessment and Management
Hazard mapping is one of the most impactful applications of GIS in geomorphology because it directly supports land-use planning and disaster preparedness.
- Landslide susceptibility mapping overlays slope angle, geological substrate, land cover, and rainfall data to identify areas most prone to failure
- Flood risk assessment integrates topography, channel geometry, hydrological flow models, and precipitation records to delineate flood-prone zones
- Coastal erosion modeling combines historical shoreline position data with sea-level rise projections to forecast future retreat
Predictive modeling extends these assessments into the future:
- Sediment transport models simulate how material moves through river systems under different flow regimes
- Coastal morphodynamics simulations forecast shoreline response to storms and long-term wave climate changes
- Glacial retreat models project ice loss in alpine environments under warming scenarios
Scenario analysis in GIS lets planners compare outcomes of different management strategies, such as how land-use changes affect erosion rates, how climate projections alter flood frequency, or how restoration projects might recover degraded landscapes.
Advanced Geomorphological Analysis and Research
GIS becomes even more powerful when coupled with specialized process models:
- Hydrological models like SWAT (Soil and Water Assessment Tool) and HEC-RAS simulate watershed-scale water and sediment dynamics
- Erosion models like RUSLE (Revised Universal Soil Loss Equation) and WEPP (Water Erosion Prediction Project) estimate soil loss under different land management scenarios
- Landscape evolution models simulate geomorphic change over thousands to millions of years
Web-based GIS platforms have expanded collaborative research through online mapping services for data sharing, cloud-based processing for handling large datasets, and participatory GIS tools that engage stakeholders in landscape management decisions.
Several geomorphological indices quantify landscape characteristics and are routinely computed in GIS:
- Topographic Position Index (TPI) compares a cell's elevation to its neighbors, enabling automated landform classification (ridges, valleys, slopes, plains)
- Stream Power Index (SPI) estimates the erosive power of flowing water by combining slope and upstream contributing area
- Connectivity Index measures how efficiently sediment moves between landscape compartments
Finally, critical evaluation of GIS limitations keeps results reliable. You should always assess data quality (accuracy, precision, completeness), consider scale dependency (patterns visible at one scale may disappear at another), and account for uncertainty propagation as errors compound through multi-step GIS workflows. Ignoring these issues can produce maps that look authoritative but misrepresent actual conditions on the ground.