Supervised learning techniques are the backbone of predictive modeling in data mining and machine learning. These methods use labeled data to train algorithms, enabling them to make accurate predictions on new, unseen information.
From to , supervised learning offers a range of tools for tackling and problems. Understanding these techniques is crucial for anyone looking to harness the power of data-driven decision-making in business and beyond.
Supervised Learning Concepts
Definition and Goal
Top images from around the web for Definition and Goal
Business Analytics in Decision Making: Data to Action - IABAC View original
Is this image relevant?
Lab 8. Supervised Learning. Decision Trees [CS Open CourseWare] View original
Business Analytics in Decision Making: Data to Action - IABAC View original
Is this image relevant?
Lab 8. Supervised Learning. Decision Trees [CS Open CourseWare] View original
Is this image relevant?
1 of 3
Supervised learning is a type of machine learning where the algorithm learns from labeled training data to make predictions or decisions on new, unseen data
The training data consists of input features (X) and corresponding output labels (y)
The goal is to learn a mapping function f(X) that can predict the correct output for new input data
Applications and Evaluation
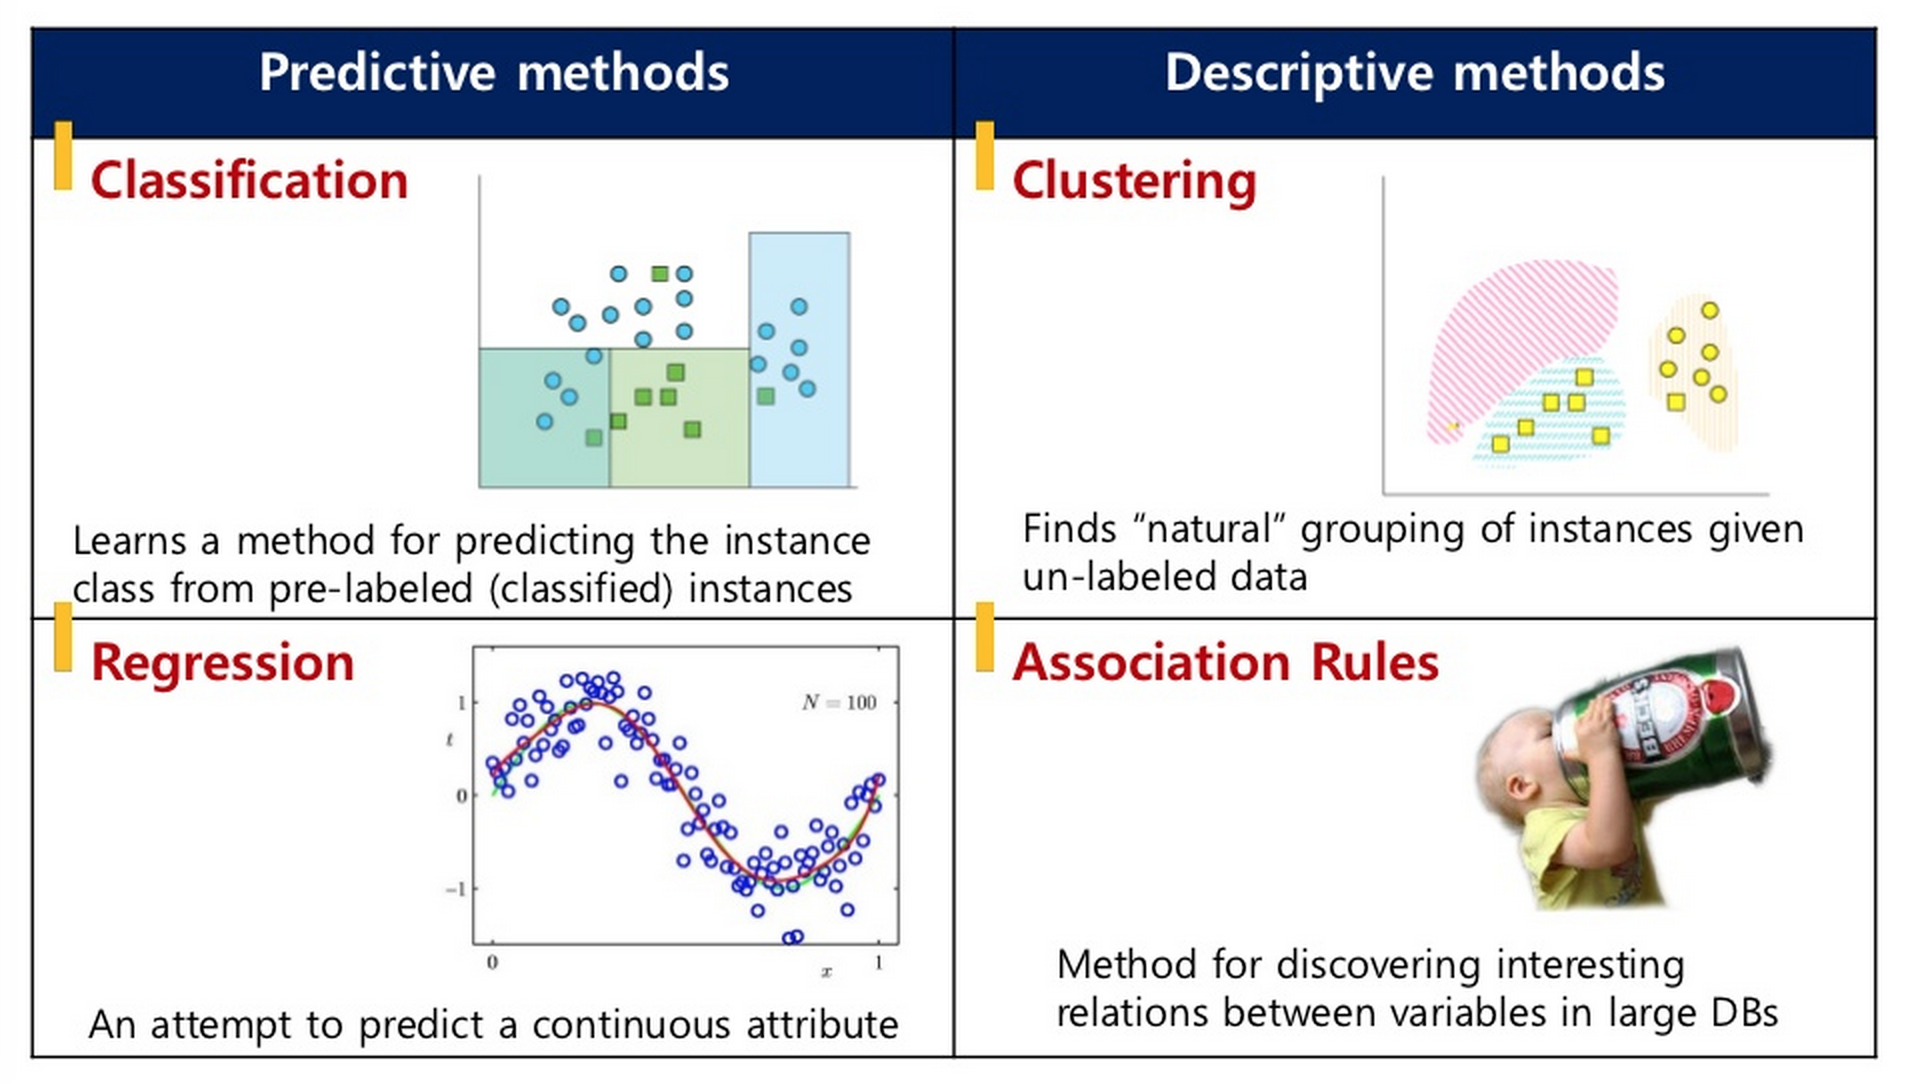
Supervised learning is commonly used for tasks such as:
Classification (predicting categorical labels such as spam email detection, image classification, sentiment analysis)
Regression (predicting continuous values such as stock price prediction, customer churn prediction)
The performance of supervised learning models is typically evaluated using metrics depending on the type of problem:
Classification metrics: , , recall, F1-score
Regression metrics: mean squared error, mean absolute error, R-squared
Linear Regression for Prediction
Overview and Equation
Linear regression is a supervised learning algorithm used for predicting continuous target variables based on one or more input features
The goal is to find the best-fitting line that minimizes the difference between the predicted and actual values
Simple linear regression involves a single input feature and a single output variable, while multiple linear regression involves multiple input features
The equation for a linear regression model is: y=β0+β1x1+β2x2+...+βnxn
y is the predicted output
x₁, x₂, ..., xₙ are the input features
β₀, β₁, β₂, ..., βₙ are the coefficients (weights) learned by the model
Coefficient Estimation and Assumptions
The coefficients are estimated using optimization techniques such as:
(OLS)
These techniques minimize the sum of squared residuals between the predicted and actual values
Assumptions of linear regression include:
Linearity: The relationship between input features and output is linear
Independence: The observations are independent of each other
Homoscedasticity: The variance of the residuals is constant across all levels of the input features
Normality: The residuals are normally distributed
Violations of these assumptions can affect the model's performance and interpretation
techniques such as L1 (Lasso) and L2 (Ridge) can be applied to linear regression to prevent overfitting and handle high-dimensional data
Logistic Regression for Classification
Binary Classification and Logistic Function
is a supervised learning algorithm used for binary classification problems
The goal is to predict the probability of an instance belonging to a particular class (usually the positive class denoted as 1)
Unlike linear regression, which predicts continuous values, logistic regression predicts the probability using the logistic (sigmoid) function
The logistic function maps the input features to a probability value between 0 and 1, representing the likelihood of the instance belonging to the positive class
Equation and Coefficient Estimation
The equation for logistic regression is: p(y=1∣x)=1+e−(β0+β1x1+β2x2+...+βnxn)1
p(y=1|x) is the probability of the instance belonging to the positive class given the input features x₁, x₂, ..., xₙ
β₀, β₁, β₂, ..., βₙ are the coefficients learned by the model
The coefficients are estimated using techniques such as:
(MLE)
Gradient descent
These techniques maximize the likelihood of observing the training data given the model parameters
The decision boundary in logistic regression is determined by a threshold probability (usually 0.5)
Above the threshold, an instance is classified as positive
Below the threshold, an instance is classified as negative
Logistic regression can be extended to handle multi-class classification problems using techniques such as (OvA) or softmax regression
Decision Trees and Random Forests
Decision Trees
are a supervised learning algorithm that can be used for both classification and regression tasks
They create a tree-like model of decisions and their possible consequences based on the input features
In a decision tree:
Each internal node represents a feature (attribute)
Each branch represents a decision rule
Each leaf node represents an outcome (class label for classification or continuous value for regression)
The tree is constructed by recursively splitting the data based on the feature that provides the most information gain or reduces the impurity the most, until a stopping criterion is met (maximum depth, minimum samples per leaf)
Decision trees have the advantage of being interpretable and able to handle both categorical and numerical features
However, they can be prone to overfitting if not properly regularized
Random Forests
are an ensemble learning method that combines multiple decision trees to improve prediction accuracy and reduce overfitting
In a random forest:
Multiple decision trees are trained on different subsets of the training data (bootstrap sampling)
At each split, a random subset of features is considered (feature bagging)
The final prediction of a random forest is obtained by aggregating the predictions of individual trees:
For classification: majority voting
For regression: averaging
Random forests have the advantage of:
Reducing overfitting
Handling high-dimensional data
Providing feature importance measures
They are widely used in various domains due to their robustness and good performance
Support Vector Machines for Classification
Optimal Hyperplane and Margin
Support vector machines (SVMs) are a powerful supervised learning algorithm primarily used for binary classification problems, particularly when dealing with complex, non-linearly separable data
The goal of an SVM is to find the optimal hyperplane that maximally separates the two classes in the feature space
The optimal hyperplane maximizes the margin (distance) between the hyperplane and the closest data points from each class ()
In linearly separable cases, the SVM finds the hyperplane that perfectly separates the two classes
In non-linearly separable cases, the SVM transforms the input features into a higher-dimensional space using (polynomial, radial basis function) to find a separating hyperplane
Optimization and Decision Function
The optimization problem in SVMs involves finding the hyperplane that minimizes the classification error while maximizing the margin
This is formulated as a quadratic programming problem and solved using techniques such as sequential minimal optimization (SMO)
The decision function of an SVM is determined by the support vectors, which are the data points closest to the hyperplane
The class prediction for a new instance is based on which side of the hyperplane it falls on
Extensions and Hyperparameter Tuning
SVMs have the advantage of being effective in high-dimensional spaces, even when the number of features exceeds the number of samples
They are also robust to outliers and have good generalization performance
SVMs can be extended to handle multi-class classification problems using techniques such as:
(OvO)
One-vs-all (OvA)
The choice of kernel function and hyperparameters is crucial for the performance of SVMs and often requires careful tuning using techniques such as
Hyperparameters include the regularization parameter C and kernel coefficients
Key Terms to Review (28)
Accuracy: Accuracy refers to the degree to which a measurement, prediction, or classification is correct and aligns with the true value or outcome. It plays a crucial role in ensuring that data visualizations are reliable, that data is processed effectively, and that models predict outcomes with precision. Achieving high accuracy is essential for meaningful analysis and insights across various applications, from data mining to machine learning and sentiment analysis.
Bias-variance tradeoff: The bias-variance tradeoff is a fundamental concept in machine learning that describes the balance between two sources of error that affect the performance of predictive models: bias, which refers to the error due to overly simplistic assumptions in the learning algorithm, and variance, which refers to the error due to excessive sensitivity to fluctuations in the training data. Understanding this tradeoff is crucial for improving model performance and achieving a good fit, as it informs decisions about model complexity, regularization techniques, and generalization capabilities.
Classification: Classification is a data analysis technique used to assign items in a dataset to target categories or classes based on their attributes. This process is crucial in making predictions about future data points and allows for the identification of patterns and trends within datasets, helping in decision-making across various domains.
Confusion matrix: A confusion matrix is a performance measurement tool for machine learning classification problems that visualizes the accuracy of a model. It provides a table layout that allows the comparison of actual and predicted classifications, highlighting true positives, false positives, true negatives, and false negatives. This tool is essential for assessing model performance, especially in understanding where errors are made and how to improve predictive accuracy.
Cross-validation: Cross-validation is a statistical method used to assess the performance and generalizability of a model by dividing the dataset into complementary subsets, training the model on one subset and validating it on another. This technique helps to prevent overfitting and ensures that the model can perform well on unseen data, making it essential for robust model evaluation across various fields like regression, classification, and time series analysis.
Decision trees: Decision trees are a popular predictive modeling technique used in statistics and machine learning that represent decisions and their possible consequences, including chance event outcomes, resource costs, and utility. They break down complex decision-making processes into simpler, more visual formats that can be easily interpreted. By splitting data into branches based on certain criteria, decision trees help to classify information and make predictions about future outcomes.
Feature Selection: Feature selection is the process of identifying and selecting a subset of relevant features from a larger set of data to improve the performance of a predictive model. It helps in reducing overfitting, enhancing the model's accuracy, and decreasing computational costs by eliminating unnecessary or redundant data. This practice is crucial in various modeling techniques, ensuring that only the most informative variables are utilized for training models.
Gradient descent: Gradient descent is an optimization algorithm used to minimize a function by iteratively moving towards the steepest descent direction defined by the negative of the gradient. This technique is crucial for training machine learning models, especially in supervised learning, as it helps to adjust the model's parameters to reduce the error between predicted and actual outcomes.
Hyperparameter tuning: Hyperparameter tuning is the process of optimizing the hyperparameters of a machine learning model to improve its performance. Hyperparameters are configuration settings that are not learned from the data but are set before the training begins, influencing how the model learns. This process is crucial for achieving better predictive accuracy and ensuring that models generalize well to unseen data.
Kernel functions: Kernel functions are mathematical tools used in machine learning algorithms, particularly in supervised learning techniques, to enable linear classifiers to work in high-dimensional spaces without explicitly mapping the data. By using a kernel function, data can be transformed and analyzed in a feature space where it becomes easier to separate different classes, allowing for improved classification performance. This approach is particularly useful in scenarios where the relationships between data points are non-linear.
Leo Breiman: Leo Breiman was a prominent statistician known for his groundbreaking work in machine learning and data analysis. He significantly contributed to the development of important supervised learning techniques, particularly through the introduction of Random Forests, which are widely used for classification and regression tasks. Breiman's work emphasized the importance of understanding model performance and the relationship between statistical models and real-world applications.
Linear regression: Linear regression is a statistical method used to model the relationship between a dependent variable and one or more independent variables by fitting a linear equation to observed data. It’s a foundational technique in supervised learning, enabling predictions and insights based on historical data patterns, where the goal is to minimize the difference between predicted values and actual outcomes.
Logistic Regression: Logistic regression is a statistical method used for binary classification that predicts the probability of a binary outcome based on one or more predictor variables. It utilizes the logistic function to model the relationship between the dependent variable and one or more independent variables, making it a key technique in supervised learning for classification tasks where the outcome is categorical.
Maximum Likelihood Estimation: Maximum likelihood estimation (MLE) is a statistical method used to estimate the parameters of a probability distribution by maximizing the likelihood function. This approach finds the values of the parameters that make the observed data most probable, effectively fitting a model to the data. MLE is widely used in various statistical modeling techniques, including supervised learning and time series forecasting.
Model training: Model training is the process of teaching a machine learning model to recognize patterns in data by feeding it a labeled dataset. During this phase, the model learns how to make predictions or classifications based on the input data and corresponding outputs. The quality and quantity of the data used in model training significantly impact the model's accuracy and generalization capabilities.
One-vs-all: One-vs-all is a classification strategy used in supervised learning where multiple binary classifiers are trained to distinguish between one class and all other classes. In this approach, for each class, a separate model is created to identify whether an instance belongs to that class or not. This technique is particularly useful when dealing with multi-class problems, as it simplifies the complexity of classification by breaking it down into multiple binary tasks.
One-vs-one: One-vs-one is a classification strategy used in machine learning, particularly in supervised learning, where multiple binary classifiers are trained to distinguish between pairs of classes. This approach is effective for multi-class classification problems, as it simplifies the decision-making process by breaking it down into a series of binary classifications. Each classifier focuses on two classes at a time, making it easier to handle complex relationships within the data.
Ordinary least squares: Ordinary least squares (OLS) is a statistical method used to estimate the parameters of a linear regression model. This technique minimizes the sum of the squared differences between the observed values and the values predicted by the linear model, providing a way to find the best-fitting line through a set of data points. OLS is fundamental in understanding how multiple independent variables can influence a dependent variable, and it plays a crucial role in predictive modeling and supervised learning.
Precision: Precision refers to the degree to which repeated measurements or predictions yield consistent results, indicating reliability and accuracy in the context of model evaluation and diagnostics. High precision means that a model’s outputs are closely clustered around the same value, leading to a better understanding of performance, particularly in distinguishing true positives from false positives in classification tasks. It is crucial for assessing the effectiveness of various techniques across different areas, ensuring that results can be trusted for decision-making.
Random forests: Random forests is a machine learning algorithm used for both classification and regression tasks that operates by constructing multiple decision trees during training time and outputting the mode of their predictions for classification or the mean prediction for regression. This technique helps improve predictive accuracy and control over-fitting by averaging the results of several trees, which makes it a powerful supervised learning method.
Regression: Regression is a statistical method used to model and analyze the relationships between a dependent variable and one or more independent variables. This technique allows for predicting outcomes and understanding the strength and form of these relationships, making it a key tool in data analysis and machine learning for identifying patterns in datasets.
Regularization: Regularization is a technique used in statistical modeling and machine learning to prevent overfitting by adding a penalty to the loss function. This penalty discourages complex models and encourages simpler models, which can generalize better on unseen data. Regularization helps maintain the balance between fitting the training data well and ensuring that the model performs adequately on new data.
Scikit-learn: scikit-learn is a powerful and widely-used machine learning library for Python that provides simple and efficient tools for data mining and data analysis. It supports both supervised and unsupervised learning, offering a range of algorithms for classification, regression, clustering, and more. The library also includes tools for model evaluation and validation, making it a go-to choice for practitioners looking to implement machine learning solutions.
Support Vector Machines: Support Vector Machines (SVM) are a set of supervised learning methods used for classification, regression, and outlier detection. They work by finding the hyperplane that best separates different classes in the feature space, maximizing the margin between the closest points of each class, known as support vectors. This approach makes SVMs powerful for predictive analytics, as they can effectively handle both linear and non-linear relationships in data.
Support Vectors: Support vectors are the data points in a dataset that are closest to the decision boundary in a support vector machine (SVM) model. These points are crucial because they directly influence the position and orientation of the hyperplane that separates different classes. In essence, support vectors are the backbone of the SVM's ability to classify data effectively, as removing them can change the optimal hyperplane.
Tensorflow: TensorFlow is an open-source machine learning framework developed by Google that enables developers to create and train machine learning models efficiently. It supports a variety of tasks such as neural networks, deep learning, and statistical modeling, making it a versatile tool in both supervised and unsupervised learning scenarios. TensorFlow allows users to define complex computational graphs, facilitating the execution of operations on multi-dimensional data arrays, or tensors.
Training set: A training set is a collection of data used to train machine learning models, helping them learn patterns and make predictions based on input data. This set is crucial for the model's development, as it enables the model to understand the relationship between input features and target outputs, ultimately improving its accuracy during evaluation and application. The quality and quantity of the training set significantly impact the performance of the model during later stages, including testing and real-world deployment.
Vladimir Vapnik: Vladimir Vapnik is a prominent Russian-American computer scientist known for his significant contributions to the field of machine learning and statistical learning theory. He is best recognized for co-developing the Support Vector Machine (SVM) algorithm, a powerful supervised learning technique that is widely used for classification and regression tasks. Vapnik's work has profoundly influenced the development of various learning algorithms and continues to shape modern approaches in data analysis.