is a powerful tool for analyzing relationships between two variables. It helps predict outcomes and understand how changes in one variable affect another, making it crucial for decision-making in various fields like business, economics, and science.
This method forms the foundation of more complex regression techniques. By mastering simple linear regression, you'll gain insights into model fitting, assumption checking, and result interpretation, setting the stage for advanced regression analysis in future studies.
Simple Linear Regression
Concept and Purpose
Top images from around the web for Concept and Purpose
Simple Linear Regression Analysis - ReliaWiki View original
Is this image relevant?
Simple Linear regression algorithm in machine learning with example graph - Codershood View original
Is this image relevant?
Simple Linear Regression Analysis - ReliaWiki View original
Is this image relevant?
Simple Linear regression algorithm in machine learning with example graph - Codershood View original
Is this image relevant?
1 of 2
Simple linear regression is a statistical method used to model and analyze the linear relationship between two continuous variables, typically denoted as the (X) and the (Y)
Identifies the nature and strength of the relationship between X and Y, allowing for predictions of the dependent variable based on the independent variable
The linear relationship between X and Y is represented by the equation: Y=β0+β1X+ε, where β0 is the y-intercept, β1 is the slope, and ε is the random error term
The slope (β1) represents the change in Y for a one-unit increase in X, while the y-intercept (β0) represents the predicted value of Y when X is zero
Assumptions
Simple linear regression assumes a linear relationship between X and Y
Independence of observations is required, meaning that the value of one observation does not influence the value of another
assumes constant variance of errors across all levels of the independent variable
of residuals assumes that the differences between observed and predicted values (residuals) follow a normal distribution
Violations of these assumptions can lead to biased or inefficient estimates and affect the validity of the model
Slope and Intercept Interpretation
Slope Interpretation
The slope (β1) represents the change in the dependent variable (Y) for a one-unit increase in the independent variable (X), holding all other factors constant
The interpretation of the slope depends on the context of the problem and the units of the variables involved
Example: If X represents years of experience and Y represents salary, a slope of 5,000 would indicate that, on average, an employee's salary increases by $5,000 for each additional year of experience
The sign of the slope (positive or negative) indicates the direction of the relationship between X and Y
Intercept Interpretation
The y-intercept (β0) represents the predicted value of the dependent variable (Y) when the independent variable (X) is zero
The interpretation of the y-intercept depends on the context of the problem and whether a zero value for X is meaningful
Example: In the salary example, a y-intercept of 30,000 would indicate that an employee with zero years of experience is expected to have a salary of $30,000
In some cases, the y-intercept may not have a practical interpretation if a zero value for X is not possible or meaningful in the context of the problem
Model Fit and Prediction
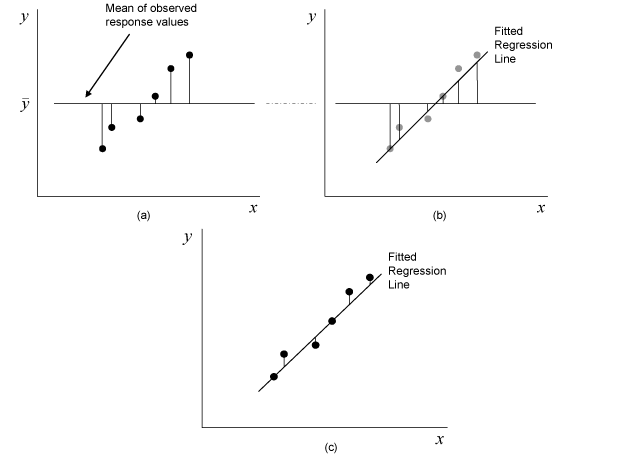
Goodness of Fit
The goodness of fit of a simple linear regression model refers to how well the model fits the observed data points
The coefficient of determination (R²) measures the proportion of variance in the dependent variable that is explained by the independent variable, ranging from 0 to 1
An R² value close to 1 indicates a strong linear relationship and good model fit, while a value close to 0 suggests a weak relationship and poor model fit
The adjusted R² accounts for the number of predictors in the model and is useful for comparing models with different numbers of predictors
Example: An R² value of 0.85 indicates that 85% of the variance in the dependent variable is explained by the independent variable
Residual Analysis
Residual analysis involves examining the differences between the observed and predicted values (residuals) to assess the model's assumptions and identify any patterns or outliers that may affect the model's validity
Residual plots (residuals vs. fitted values, residuals vs. independent variable) can help identify violations of linearity, homoscedasticity, and independence assumptions
Example: A residual plot showing a random scatter of points around zero with no discernible pattern suggests that the model's assumptions are met
Predictive Power
Predictive power refers to the model's ability to accurately predict the dependent variable for new observations
The standard error of the estimate measures the average distance between the observed values and the predicted values, providing an estimate of the model's predictive accuracy
Prediction intervals can be constructed to quantify the uncertainty associated with predictions for new observations
Example: A 95% prediction interval for a new observation indicates that there is a 95% probability that the true value of the dependent variable for that observation falls within the interval
Regression Applications
Problem Identification
Identifying the dependent and independent variables is the first step in applying simple linear regression to real-world problems
The dependent variable (Y) is the outcome or response variable that is being predicted or explained
The independent variable (X) is the predictor or explanatory variable that is used to predict or explain the dependent variable
Example: In a study of the relationship between advertising expenditure and sales, advertising expenditure would be the independent variable (X), and sales would be the dependent variable (Y)
Data Preparation
Data collection and preprocessing involve gathering relevant data, handling missing values, and ensuring data quality for analysis
Data cleaning may involve removing outliers, transforming variables (e.g., log transformation), or addressing multicollinearity (high between independent variables)
Example: Before fitting a simple linear regression model, missing values in the dataset may need to be imputed using techniques such as mean imputation or regression imputation
Model Fitting and Interpretation
Fitting the simple linear regression model to the data using statistical software or programming languages (R, Python) enables the estimation of the slope and intercept coefficients
Interpreting the model coefficients, goodness of fit measures, and statistical significance tests (t-tests for coefficients, F-test for overall model significance) in the context of the problem is crucial for drawing meaningful conclusions
Assessing the model's assumptions (linearity, independence, homoscedasticity, normality of residuals) is essential to ensure the validity of the conclusions drawn from the model
Example: A statistically significant positive slope coefficient for advertising expenditure would indicate that increasing advertising expenditure is associated with higher sales
Prediction and Communication
Using the fitted model to make predictions for new observations and quantifying the uncertainty associated with these predictions (prediction intervals) enables informed decision-making based on the model results
Communicating the findings, limitations, and implications of the simple linear regression analysis to stakeholders in a clear and concise manner is essential for effective application of the results in real-world settings
Example: Based on the fitted model, a company may predict that increasing advertising expenditure by 10,000isexpectedtoresultinanincreaseinsalesof50,000, with a 95% prediction interval of [35,000,65,000]
Key Terms to Review (18)
Causation: Causation refers to the relationship between two events or variables where one event is the result of the other. Understanding causation is crucial in identifying not just correlations but also determining whether changes in one variable directly cause changes in another, which is particularly important when analyzing data distributions and the relationships between variables or when creating predictive models like simple linear regression.
Correlation: Correlation is a statistical measure that describes the extent to which two variables are related to each other. It indicates how changes in one variable may be associated with changes in another, helping to identify patterns or trends. Understanding correlation is essential for summarizing data, analyzing relationships, predicting outcomes, and evaluating risks in various scenarios.
Cross-validation: Cross-validation is a statistical method used to assess the performance and generalizability of a model by dividing the dataset into complementary subsets, training the model on one subset and validating it on another. This technique helps to prevent overfitting and ensures that the model can perform well on unseen data, making it essential for robust model evaluation across various fields like regression, classification, and time series analysis.
Dependent variable: A dependent variable is a key concept in statistics and research, representing the outcome or response that is measured in an experiment or study. It is influenced by one or more independent variables, which are manipulated to observe their effect on the dependent variable. Understanding the role of the dependent variable is crucial for analyzing relationships and drawing conclusions from data.
Extrapolation: Extrapolation is a statistical technique used to estimate or predict the value of a variable beyond the range of known data points. It relies on identifying patterns or trends in the existing data and extending these trends into the unknown areas. This method is especially useful in forecasting future outcomes based on historical data, but it also carries risks, as assumptions made outside the observed range may lead to inaccuracies.
Feature Selection: Feature selection is the process of identifying and selecting a subset of relevant features from a larger set of data to improve the performance of a predictive model. It helps in reducing overfitting, enhancing the model's accuracy, and decreasing computational costs by eliminating unnecessary or redundant data. This practice is crucial in various modeling techniques, ensuring that only the most informative variables are utilized for training models.
Francis Galton: Francis Galton was a Victorian polymath known for his pioneering work in statistics, psychology, and the study of human differences. He is credited with developing concepts that laid the groundwork for various statistical methods, including correlation and regression, which are crucial in understanding relationships between variables.
Homoscedasticity: Homoscedasticity refers to the assumption in regression analysis that the variance of the errors is constant across all levels of the independent variable. This means that as the values of the independent variable change, the spread or variability of the residuals remains the same. It is an important concept because violations of this assumption can lead to inefficient estimates and affect hypothesis testing, making results unreliable.
Independent Variable: An independent variable is a variable in an experiment or a statistical model that is manipulated or controlled to observe its effect on another variable, known as the dependent variable. This term is essential in understanding how changes in one factor can lead to changes in another, helping to establish cause-and-effect relationships in research.
Interpolation: Interpolation is a statistical method used to estimate unknown values that fall within the range of a discrete set of known data points. It helps in making predictions or filling in gaps in data, allowing analysts to create smoother and more accurate representations of trends. This technique is particularly useful in various analytical contexts, such as making sense of complex datasets and developing regression models to understand relationships between variables.
Multiple linear regression: Multiple linear regression is a statistical technique used to model the relationship between one dependent variable and two or more independent variables. This method helps in understanding how various factors collectively influence the outcome and allows for predictions based on multiple inputs. By examining the coefficients of the independent variables, it provides insight into their individual contributions to the dependent variable while controlling for the effects of other variables.
Normality: Normality refers to the statistical assumption that data are distributed in a symmetrical, bell-shaped curve known as the normal distribution. This concept is crucial because many statistical techniques rely on the idea that data points will cluster around a central mean, with a predictable pattern of variation. When this assumption holds, it enables the use of parametric tests and models that require normally distributed data, facilitating more accurate predictions and insights.
P-value: A p-value is a statistical measure that helps determine the significance of results obtained from a hypothesis test. It quantifies the probability of observing data at least as extreme as the sample data, assuming that the null hypothesis is true. A smaller p-value indicates stronger evidence against the null hypothesis, which is crucial in making decisions about the validity of statistical claims.
R-squared: R-squared is a statistical measure that represents the proportion of the variance for a dependent variable that's explained by an independent variable or variables in a regression model. It provides insights into how well the data fits the regression model, indicating the strength of the relationship between the independent and dependent variables.
Sales forecasting: Sales forecasting is the process of estimating future sales revenue based on historical data, market analysis, and trends. It plays a critical role in decision-making for businesses by providing insights that help in planning and resource allocation. This process involves utilizing various analytical techniques to predict sales volumes, which can be descriptive, predictive, or prescriptive in nature.
Simple linear regression: Simple linear regression is a statistical method used to model the relationship between two variables by fitting a linear equation to observed data. It helps in understanding how the dependent variable changes as the independent variable varies, providing insights that can inform decision-making and forecasting.
Sir Ronald A. Fisher: Sir Ronald A. Fisher was a prominent statistician and geneticist known for his foundational contributions to the field of statistics, particularly in experimental design and the development of statistical methods. His work laid the groundwork for modern statistics, including the application of statistical techniques in simple linear regression, which helps in understanding relationships between variables and making predictions.
Trend analysis: Trend analysis is the practice of collecting and analyzing data over time to identify patterns, directions, or trends in that data. This method helps businesses and analysts understand how various factors change and influence outcomes, making it crucial for decision-making processes, forecasting, and strategic planning.