AP exam review verified for 2027

AP Microeconomics Big Ideas Review

AP Microeconomics is organized around four big ideas that show up in every unit, every graph, and every exam question. Learning to recognize which big idea is driving a scenario is one of the fastest ways to know what the question is actually asking you to do.

Use this page to see how the four big ideas connect across the course, then dig into the individual topic guides for each one.

What are the AP Microeconomics big ideas?

AP Microeconomics groups its content under four official big ideas: Scarcity and Markets (MKT), Costs, Benefits, and Marginal Analysis (CBA), Production Choices and Behavior (PRD), and Market Inefficiency and Public Policy (POL). These are not just organizational labels. They are the reasoning frameworks the exam expects you to apply when you analyze a graph, explain a firm decision, or evaluate a policy.

The four big ideas tell you why economics exists (scarcity), how decisions are made (marginal analysis), how firms behave (production choices), and when markets need correction (public policy). Together they cover every major topic in the course.

MKT and CBA anchor Units 1 and 2

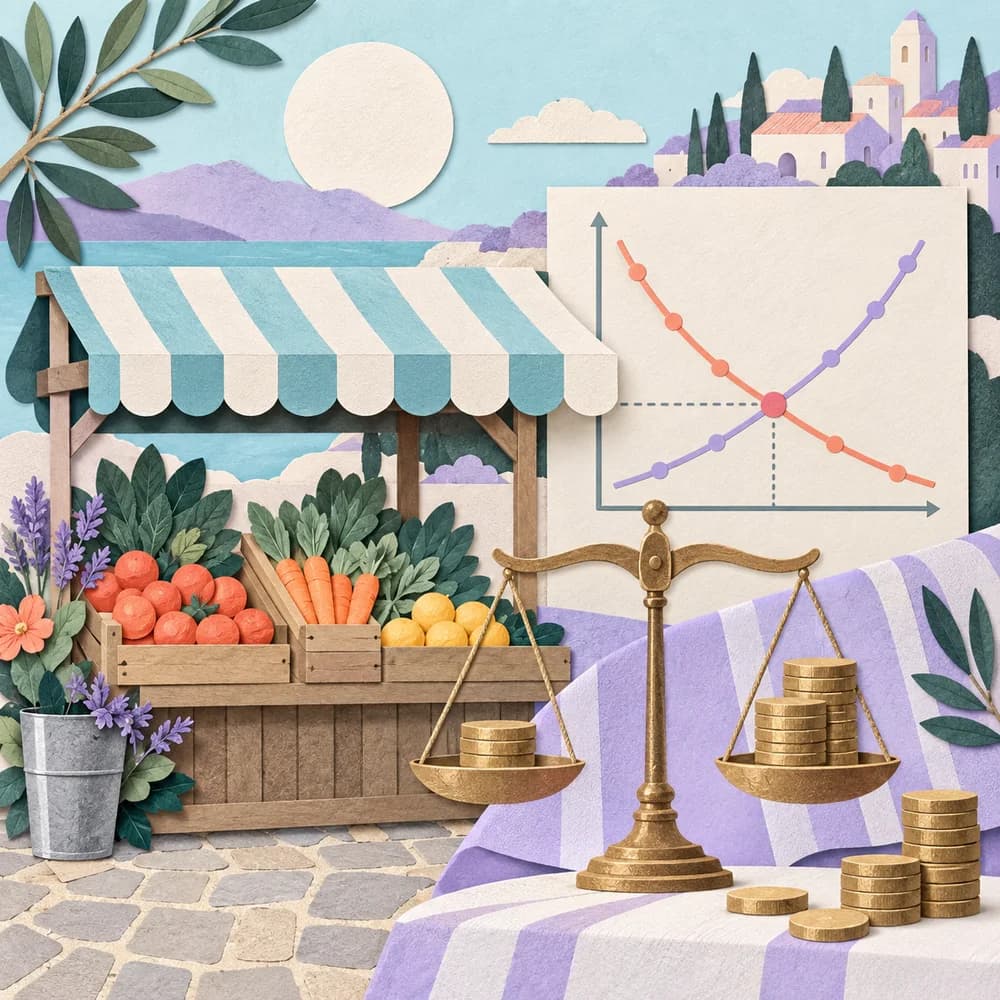
Scarcity and Markets explains why choices must be made and how prices coordinate those choices through supply and demand. Costs, Benefits, and Marginal Analysis gives you the decision rule: compare marginal benefit to marginal cost. These two big ideas together explain consumer behavior, elasticity, and market equilibrium before you ever touch a firm model.
PRD drives Units 3, 4, and 5

Production Choices and Behavior is the lens for everything firms do. It covers short-run and long-run cost curves, the profit-maximization rule (MR = MC), and how firm behavior changes across market structures from perfect competition to monopoly to oligopoly. Factor markets in Unit 5 are also a PRD application, where firms hire labor up to the point where MRP equals the wage.

POL ties together Unit 6 and revisits earlier units

Market Inefficiency and Public Policy asks when private markets fail and what government should do. Externalities, public goods, and market power all create deadweight loss. POL gives you the framework for evaluating taxes, subsidies, price controls, and regulations, and it connects back to MKT and CBA because every policy involves a trade-off between efficiency and equity.

Why the big ideas matter on the exam

The AP exam does not just test whether you memorized a graph. It tests whether you can apply a framework to a new scenario. When you see a question about a firm choosing output, that is PRD plus CBA. When you see a question about a tax correcting an externality, that is POL plus CBA. Recognizing the big idea behind a question tells you which model to draw, which rule to apply, and which direction the effect runs.

Thematic study guides

1

Scarcity and Markets (MKT)

Covers opportunity cost, the PPC, supply and demand, elasticity, and consumer and producer surplus. This is the starting framework for the entire course and the foundation for understanding why prices exist and what they do.

open guide
2

Costs, Benefits, and Marginal Analysis (CBA)

Traces the marginal decision rule from consumer utility maximization through firm output decisions. Every time you apply MR = MC or compare MU per dollar across goods, you are using CBA.

open guide
3

Production Choices and Behavior (PRD)

Covers short-run and long-run cost curves, profit maximization across all four market structures, and factor market hiring decisions. The MR = MC rule and the shutdown condition are the core tools.

open guide
4

Market Inefficiency and Public Policy (POL)

Explains externalities, public goods, and market power as sources of market failure, then evaluates taxes, subsidies, price controls, and regulation as policy responses. Deadweight loss diagrams are central.

open guide

Big ideas review notes

Big Idea 1

Scarcity and Markets (MKT)

MKT is the foundation. It establishes that resources are limited, wants are unlimited, and prices are the mechanism that allocates goods in a market economy. Every supply-and-demand shift, every elasticity calculation, and every consumer surplus triangle is an MKT application.

  • Scarcity: The condition that forces choice because resources are finite relative to wants.
  • Opportunity cost: The value of the next-best alternative given up when a choice is made.
  • Market equilibrium: The price and quantity where quantity supplied equals quantity demanded, clearing the market.
  • Consumer and producer surplus: The welfare gains to buyers and sellers from voluntary exchange, measured as areas on a supply-and-demand diagram.
Can you shift a supply or demand curve, find the new equilibrium, and explain what happened to consumer surplus, producer surplus, and total welfare?
ConceptWhere it appears in the courseKey graph or tool
Scarcity and opportunity costUnit 1: Basic Economic ConceptsProduction Possibilities Curve
Supply and demandUnit 2: Supply, Demand, and Market EquilibriumSupply-demand diagram
ElasticityUnit 2Slope and percentage-change calculations
Consumer and producer surplusUnit 2 and Unit 6Area triangles on supply-demand diagram
Big Idea 2

Costs, Benefits, and Marginal Analysis (CBA)

CBA is the decision rule that runs through every unit. The core logic is always the same: a rational agent takes an action if and only if the marginal benefit is at least as large as the marginal cost. This applies to consumers maximizing utility, firms choosing output, and governments evaluating policy.

  • Marginal benefit: The additional benefit gained from one more unit of an activity.
  • Marginal cost: The additional cost incurred from one more unit of an activity.
  • Allocative efficiency: Achieved when P = MC, meaning the value buyers place on the last unit equals the cost of producing it.
  • Utility maximization: Consumers maximize satisfaction by consuming where MU per dollar is equal across all goods.
Given a table of total costs and total revenues, can you calculate marginal cost and marginal revenue and identify the profit-maximizing output level?
Decision makerCBA rule appliedUnit
ConsumerBuy more until MU/P is equal across goodsUnit 2
Competitive firmProduce until MR = MC; shut down if P < AVCUnit 3
MonopolistProduce until MR = MC; set price from demand curveUnit 4
GovernmentImplement policy until marginal social benefit = marginal social costUnit 6
Big Idea 3

Production Choices and Behavior (PRD)

PRD explains firm behavior from the inside out. It covers how costs are structured in the short run and long run, how firms choose output to maximize profit, and how market structure changes the outcome. The MR = MC rule is the centerpiece, but you also need to know when a firm shuts down, when it exits, and how long-run equilibrium differs across market structures.

  • Fixed vs. variable costs: Fixed costs do not change with output in the short run; variable costs do.
  • Marginal revenue (MR): The additional revenue from selling one more unit; equals price for a competitive firm, falls below price for a monopolist.
  • Profit maximization rule: A firm maximizes profit by producing where MR = MC, then checking that price covers average variable cost.
  • Marginal revenue product (MRP): The additional revenue generated by hiring one more unit of a factor; firms hire until MRP equals the factor price.
Can you draw the cost curves for a perfectly competitive firm, show the profit-maximizing output, shade the profit or loss area, and explain what happens in the long run?
Market structurePrice vs. MRLong-run profitEfficiency
Perfect competitionP = MRZero economic profitAllocatively and productively efficient
Monopolistic competitionP > MRZero economic profitNeither allocatively nor productively efficient
MonopolyP > MRPositive economic profit possibleNot allocatively efficient; deadweight loss
OligopolyP > MR (typically)Positive economic profit possibleDepends on degree of collusion
Big Idea 4

Market Inefficiency and Public Policy (POL)

POL asks when markets fail to reach the socially optimal outcome and what policy can do about it. The three main sources of market failure are externalities, public goods, and market power. Each creates deadweight loss, and each calls for a different policy response. POL also introduces the equity-efficiency trade-off, which appears in questions about price controls and income distribution.

  • Negative externality: A cost imposed on a third party not involved in the transaction; leads to overproduction relative to the social optimum.
  • Positive externality: A benefit received by a third party; leads to underproduction relative to the social optimum.
  • Deadweight loss: The loss of total surplus that results when output is not at the socially optimal level.
  • Pigouvian tax or subsidy: A tax equal to the marginal external cost (or a subsidy equal to the marginal external benefit) that corrects an externality by internalizing it.
  • Public good: A good that is non-excludable and non-rival; private markets underprovide it because of the free-rider problem.
Can you draw the negative externality diagram, label the market output, the socially optimal output, and the deadweight loss, and then show how a corrective tax shifts the outcome?
Market failure typeProblemPolicy response
Negative externalityOverproduction; MSC > MPCPigouvian tax; cap-and-trade
Positive externalityUnderproduction; MSB > MPBSubsidy to producers or consumers
Public goodUnderprovision due to free-rider problemGovernment provision or funding
Market power (monopoly)Underproduction; P > MC; deadweight lossRegulation, antitrust, or price ceiling at P = MC

Common mistakes

Confusing accounting profit with economic profit

Economic profit subtracts implicit costs, including the opportunity cost of the owner's time and capital, from total revenue. A firm can earn positive accounting profit and zero economic profit at the same time. Long-run equilibrium in perfect competition means zero economic profit, not zero accounting profit.

Drawing the monopolist's price from the MR curve instead of the demand curve

The monopolist produces where MR = MC to find quantity, then goes straight up to the demand curve to find price. The price is always above MR for a monopolist. Setting price at the MR = MC intersection is one of the most common diagram errors on the exam.

Forgetting that a corrective tax shifts supply, not demand

A Pigouvian tax on producers increases their marginal cost, which shifts the supply curve left (or up by the amount of the tax). Students sometimes shift the demand curve instead. The result of a correctly drawn tax is that market output falls to the socially optimal level and the deadweight loss disappears.

Treating all externalities as requiring the same policy

Negative externalities call for taxes or quantity restrictions. Positive externalities call for subsidies. Public goods call for government provision. These are different problems with different solutions. Applying a tax to a positive externality would make the underproduction problem worse.

Ignoring the shutdown condition when analyzing firm losses

A firm running a loss does not automatically shut down. In the short run, it continues operating as long as price covers average variable cost, because fixed costs are sunk. Only when P falls below AVC does the firm minimize losses by shutting down. Confusing AVC with ATC here leads to wrong conclusions about firm behavior.

How this theme shows up on the AP exam

Multiple-choice questions test big idea recognition and application

Most AP Micro MCQs present a scenario and ask you to predict an outcome, identify an effect, or read a graph. The fastest path to the right answer is recognizing the big idea: if the question involves a firm choosing output, apply PRD and CBA (MR = MC). If it involves a tax on a market with an externality, apply POL. Misidentifying the big idea usually leads to choosing a distractor that is true in a different context.

Free-response questions often require you to apply multiple big ideas in sequence

A typical FRQ might ask you to draw a perfectly competitive firm in long-run equilibrium (PRD), then introduce a tax that creates a negative externality correction (POL and CBA), then ask how the market adjusts (MKT). Each part of the question is testing a different big idea, and the graders are looking for the correct diagram, the correct label, and the correct direction of change for each one.

Explanation prompts require you to name the mechanism, not just the direction

When an FRQ asks you to explain why output falls or why price rises, a complete answer names the mechanism tied to a big idea. For example: output falls because the tax raises marginal cost above marginal revenue at the original quantity, so the firm reduces production until MR = MC again (CBA and PRD). Saying only that output falls earns no explanation credit. The big idea framework gives you the language to write complete, scorable responses.

Review checklist

  • Identify which big idea a question is testingBefore you answer any question, ask yourself: is this about scarcity and price coordination (MKT), a marginal decision (CBA), firm cost or output behavior (PRD), or a market failure and policy response (POL)? The answer tells you which model and which rule to use.
  • Know the MR = MC rule cold and know its limitsMR = MC gives you the profit-maximizing output for any firm. But you also need to know the shutdown condition (P < AVC in the short run), the exit condition (P < ATC in the long run), and how to read profit or loss as a shaded rectangle on the diagram.
  • Practice drawing and labeling all major diagramsThe exam expects accurate, labeled graphs. For each market structure, you should be able to draw the cost curves, mark the profit-maximizing output, label the price, and shade the profit or loss area. For externality questions, draw both the private and social curves and mark the deadweight loss triangle.
  • Connect CBA to every unitMarginal analysis is not just a Unit 1 concept. Review how it appears in consumer theory (MU/P equalization), firm theory (MR = MC), factor markets (MRP = factor price), and policy analysis (marginal social benefit vs. marginal social cost).
  • Distinguish efficiency from equity in POL questionsA policy can improve efficiency (reduce deadweight loss) while worsening equity, or vice versa. Price ceilings, for example, may help low-income consumers but create shortages and reduce total surplus. Be ready to evaluate both dimensions separately.
  • Review long-run equilibrium for each market structurePerfect competition and monopolistic competition both reach zero economic profit in the long run through entry and exit, but only perfect competition achieves allocative and productive efficiency. Monopoly and oligopoly can sustain positive profit because barriers to entry block the adjustment.
  • Use the topic guides for each big ideaAll four topic guides are available on Fiveable. Each one traces its big idea across units, explains where it appears on the exam, and walks through the key diagrams and decision rules. Work through them in order or jump to the one you find hardest.

How to study big ideas

Start with MKT and CBA as a pairRead the Scarcity and Markets topic guide first to lock in supply and demand, elasticity, and surplus. Then read the Costs, Benefits, and Marginal Analysis topic guide to understand the decision rule that connects every model in the course. These two big ideas together cover Units 1 and 2 and set up everything that follows.
Work through PRD by market structureRead the Production Choices and Behavior topic guide and practice drawing cost curves and profit diagrams for each market structure in order: perfect competition, monopoly, monopolistic competition, oligopoly. For each one, identify the profit-maximizing output, the price, and the long-run outcome before moving to the next.
Tackle POL last and connect it back to earlier big ideasRead the Market Inefficiency and Public Policy topic guide after you are comfortable with MKT, CBA, and PRD. Externality diagrams build on supply and demand (MKT), corrective taxes use marginal reasoning (CBA), and monopoly as a source of market failure connects to firm behavior (PRD). POL makes more sense once the other three are solid.
Use the AP score calculator to set a targetThe Fiveable AP score calculator can help you estimate what score your current level of preparation is likely to produce and how much improvement in specific areas would move your score. Use it to prioritize which big ideas to focus on in your remaining study time.
Review by asking which big idea each practice scenario testsAs you work through any practice material, label each question with its big idea before you solve it. This habit builds the pattern recognition you need to move quickly on the actual exam and to know immediately which diagram or rule applies.

More ways to review

Topic study guides

Open the individual guides for Big Ideas when you want a closer review of one topic.

browse guides

FRQ practice

Practice free-response reasoning and compare your answer with scoring guidance.

practice FRQs

Cheatsheets

Use unit cheatsheets for a quick visual review after you work through the notes.

open cheatsheets

Score calculator

Estimate your broader AP score goal after you review the course and exam format.

open calculator
Ready to review Big Ideas?Start with the notes, check the topic cards, and use the practice or resource links when they are available for this course.