AP Psychology AAQ Practice
77 Article Analysis Questions written in the AP format. Pick one, read the full question, and write your response. Fiveable scores each AAQ response part by part on the AP rubric.
Your first scored response is included. A plan unlocks unlimited scoring.
77 questions
sorted by unit
Motor reaction speed and sleep deprivation effects
Unit 1: Biological Bases of Behavior
Using the source provided, respond to all parts of the question.
Your response to the question should be provided in six parts: A, B, C, D, E, and F. Write the response to each part of the question in complete sentences. Use appropriate psychological terminology in your response.
Identify the research method used in the study.
State the operational definition of motor reaction speed in the study.
Describe what the mean indicates for the reaction time between the Total Deprivation Group and the Control Group.
Identify one ethical guideline described in the study. Describe one way the researchers in the study applied this ethical guideline.
Explain the extent to which the research findings may or may not be generalizable using specific and relevant evidence from the study.
Explain how the research findings support or refute the restorative theory of sleep.
This study investigated whether reducing or eliminating sleep the night before testing would impair participants' ability to respond quickly to visual stimuli. The research was designed to test predictions derived from the Restorative Theory of Sleep, which posits that sleep serves a critical biological function in restoring neural and cognitive resources depleted during waking hours.
Total N: 90
Recruitment: Participants were recruited from the introductory psychology research pool at a large Midwestern public university during the Fall 2022 semester.
Gender: 51.1% women (n = 46), 46.7% men (n = 42), 2.2% non-binary or other gender identity (n = 2)
Race/Ethnicity: 64.4% White (n = 58), 17.8% Asian (n = 16), 8.9% Black or African American¹ (n = 8), 6.7% Hispanic or Latino (n = 6), 2.2% multiracial or other (n = 2)
Age Range: 18-24 years
Age Mean: 19.8
Age SD: 1.4
Compensation: Participants received 2 hours of research credit toward their introductory psychology course requirement and a $15 gift card for completing the overnight portion of the study.
A standardized sleep laboratory with individual sleeping rooms equipped with beds, blackout curtains, and temperature control set to 68°F
A desktop computer running PsychoPy software (version 2022.2.4) to present visual stimuli and record reaction times with millisecond precision
A standard computer keyboard with a designated response key (spacebar) for participant responses
A bright yellow circle (5 cm diameter) presented on a black background as the visual stimulus
Actigraphy wristbands to verify participants' sleep duration during the experimental night
The Epworth Sleepiness Scale (ESS) administered pre-screening to exclude participants with existing sleep disorders
Prior to participation, all individuals completed an informed consent process in which researchers explained the study procedures, potential risks of sleep deprivation (including fatigue and temporary cognitive impairment), the voluntary nature of participation, and their right to withdraw at any time without penalty. Participants signed the consent form before any data collection began.
Participants completed a pre-screening questionnaire that included the Epworth Sleepiness Scale and questions about caffeine use, sleep disorders, and current medications. Those with scores indicating excessive daytime sleepiness (ESS > 10) or who reported diagnosed sleep disorders were excluded from participation.
Eligible participants were randomly assigned to one of three experimental conditions using a computer-generated randomization sequence: the Control Group (n = 30), the Partial Deprivation Group (n = 30), or the Total Deprivation Group (n = 30).
All participants arrived at the sleep laboratory at 9:00 PM on the evening of testing. They were instructed to abstain from caffeine and alcohol for 24 hours prior to arrival, which was verified through self-report.
Control Group participants were permitted to sleep for 8 hours in the sleep lab (11:00 PM to 7:00 AM). Partial Deprivation Group participants remained awake in a comfortable lounge area with access to books, magazines, and board games until 3:00 AM, then slept for 4 hours (3:00 AM to 7:00 AM). Total Deprivation Group participants were kept awake for the entire night (0 hours of sleep) under continuous supervision by research assistants who engaged them in low-stimulation activities.
At 8:00 AM, all participants consumed a standardized light breakfast and were given 30 minutes to prepare for testing. No caffeine was provided.
At 8:30 AM, participants completed the reaction time task. They were seated 60 cm from the computer monitor and instructed to press the spacebar as quickly as possible each time the yellow circle appeared on the screen. The task consisted of 50 trials with randomized inter-stimulus intervals² ranging from 2 to 5 seconds to prevent anticipatory responses.
Reaction time was recorded in milliseconds (ms) from stimulus onset to key press for each trial. Responses faster than 100 ms were classified as anticipatory errors and excluded from analysis, and responses slower than 1500 ms were classified as lapses.
Following testing, all participants were debriefed about the study hypotheses and provided with a comfortable space to rest before leaving the laboratory. Participants in the deprivation conditions were advised not to drive and were offered transportation home.
Control Group: Participants slept for 8 hours (11:00 PM to 7:00 AM) in the sleep lab under normal conditions.
Partial Deprivation Group: Participants slept for 4 hours (3:00 AM to 7:00 AM) in the sleep lab after remaining awake during the early night hours.
Total Deprivation Group: Participants were kept awake for the entire night (0 hours of sleep) under continuous supervision by research staff.
Reaction time was measured as the duration in milliseconds (ms) between the onset of a visual stimulus (yellow circle appearing on the computer screen) and the participant's key press response (pressing the spacebar). For each participant, the mean reaction time was calculated across all 50 valid trials, excluding anticipatory responses (< 100 ms) and lapses (> 1500 ms).
Informed consent was obtained from all participants prior to their involvement in the study. The consent process included a detailed explanation of the study procedures, potential risks associated with sleep deprivation (such as fatigue, irritability, and temporary cognitive impairment), the voluntary nature of participation, and participants' right to withdraw from the study at any time without penalty or loss of compensation.
The results revealed a clear pattern: as sleep duration decreased, reaction times increased substantially. Participants in the Control Group (8 hours of sleep) demonstrated the fastest mean reaction time at 247.3 ms, while the Partial Deprivation Group (4 hours of sleep) showed a 51.3 ms increase with a mean of 298.6 ms. The Total Deprivation Group (0 hours of sleep) exhibited the slowest performance with a mean reaction time of 364.2 ms—representing a 116.9 ms increase compared to well-rested participants. Additionally, the percentage of lapse trials increased dramatically from 1.2% in the Control Group to 11.3% in the Total Deprivation Group, indicating that sleep-deprived participants experienced more frequent attentional failures during the task.
Measure | Control Group (8 hours sleep) | Partial Deprivation Group (4 hours sleep) | Total Deprivation Group (0 hours sleep) |
|---|---|---|---|
Mean Reaction Time (ms) | 247.3 | 298.6 | 364.2 |
Standard Deviation (ms) | 32.1 | 45.8 | 71.4 |
Percentage of Lapse Trials (> 1500 ms) | 1.2% | 4.7% | 11.3% |
Mean Self-Reported Fatigue (1-10 scale) | 2.8 | 5.4 | 8.1 |
These findings demonstrate that sleep deprivation significantly impairs motor reaction speed and increases response variability, with greater sleep loss producing more pronounced deficits in performance. The results provide strong support for the Restorative Theory of Sleep, which proposes that sleep is essential for restoring cognitive and neural resources that become depleted during periods of wakefulness. According to this theory, the accumulation of adenosine and other metabolic byproducts during waking hours impairs neural processing efficiency, and sleep allows the brain to clear these substances and restore optimal functioning. The progressive decline in reaction time performance observed across conditions—from full sleep to partial deprivation to total deprivation—is consistent with the prediction that longer periods without sleep result in greater depletion of neural resources and correspondingly greater impairment in cognitive-motor performance.
Thornton, R. M., Chen, A. L., & Balderas, J. F. (2023). Sleep deprivation and psychomotor vigilance: Evidence for restorative neural mechanisms in reaction time performance. Journal of Experimental Psychology: Human Performance and Cognition, 49(3), 412-428. https://doi.org/10.1037/xhp0001087
- Demographic categories for race and ethnicity were based on participant self-identification using categories consistent with current NIH reporting standards. The terminology used reflects the language provided by participants and standard classifications in psychological research at the time of data collection.
- Inter-stimulus interval (ISI) refers to the duration of time between the end of one stimulus presentation and the beginning of the next. Randomizing the ISI prevents participants from predicting when the next stimulus will appear, ensuring that measured reaction times reflect genuine perceptual-motor processing rather than anticipatory timing strategies.
What the AAQ asks
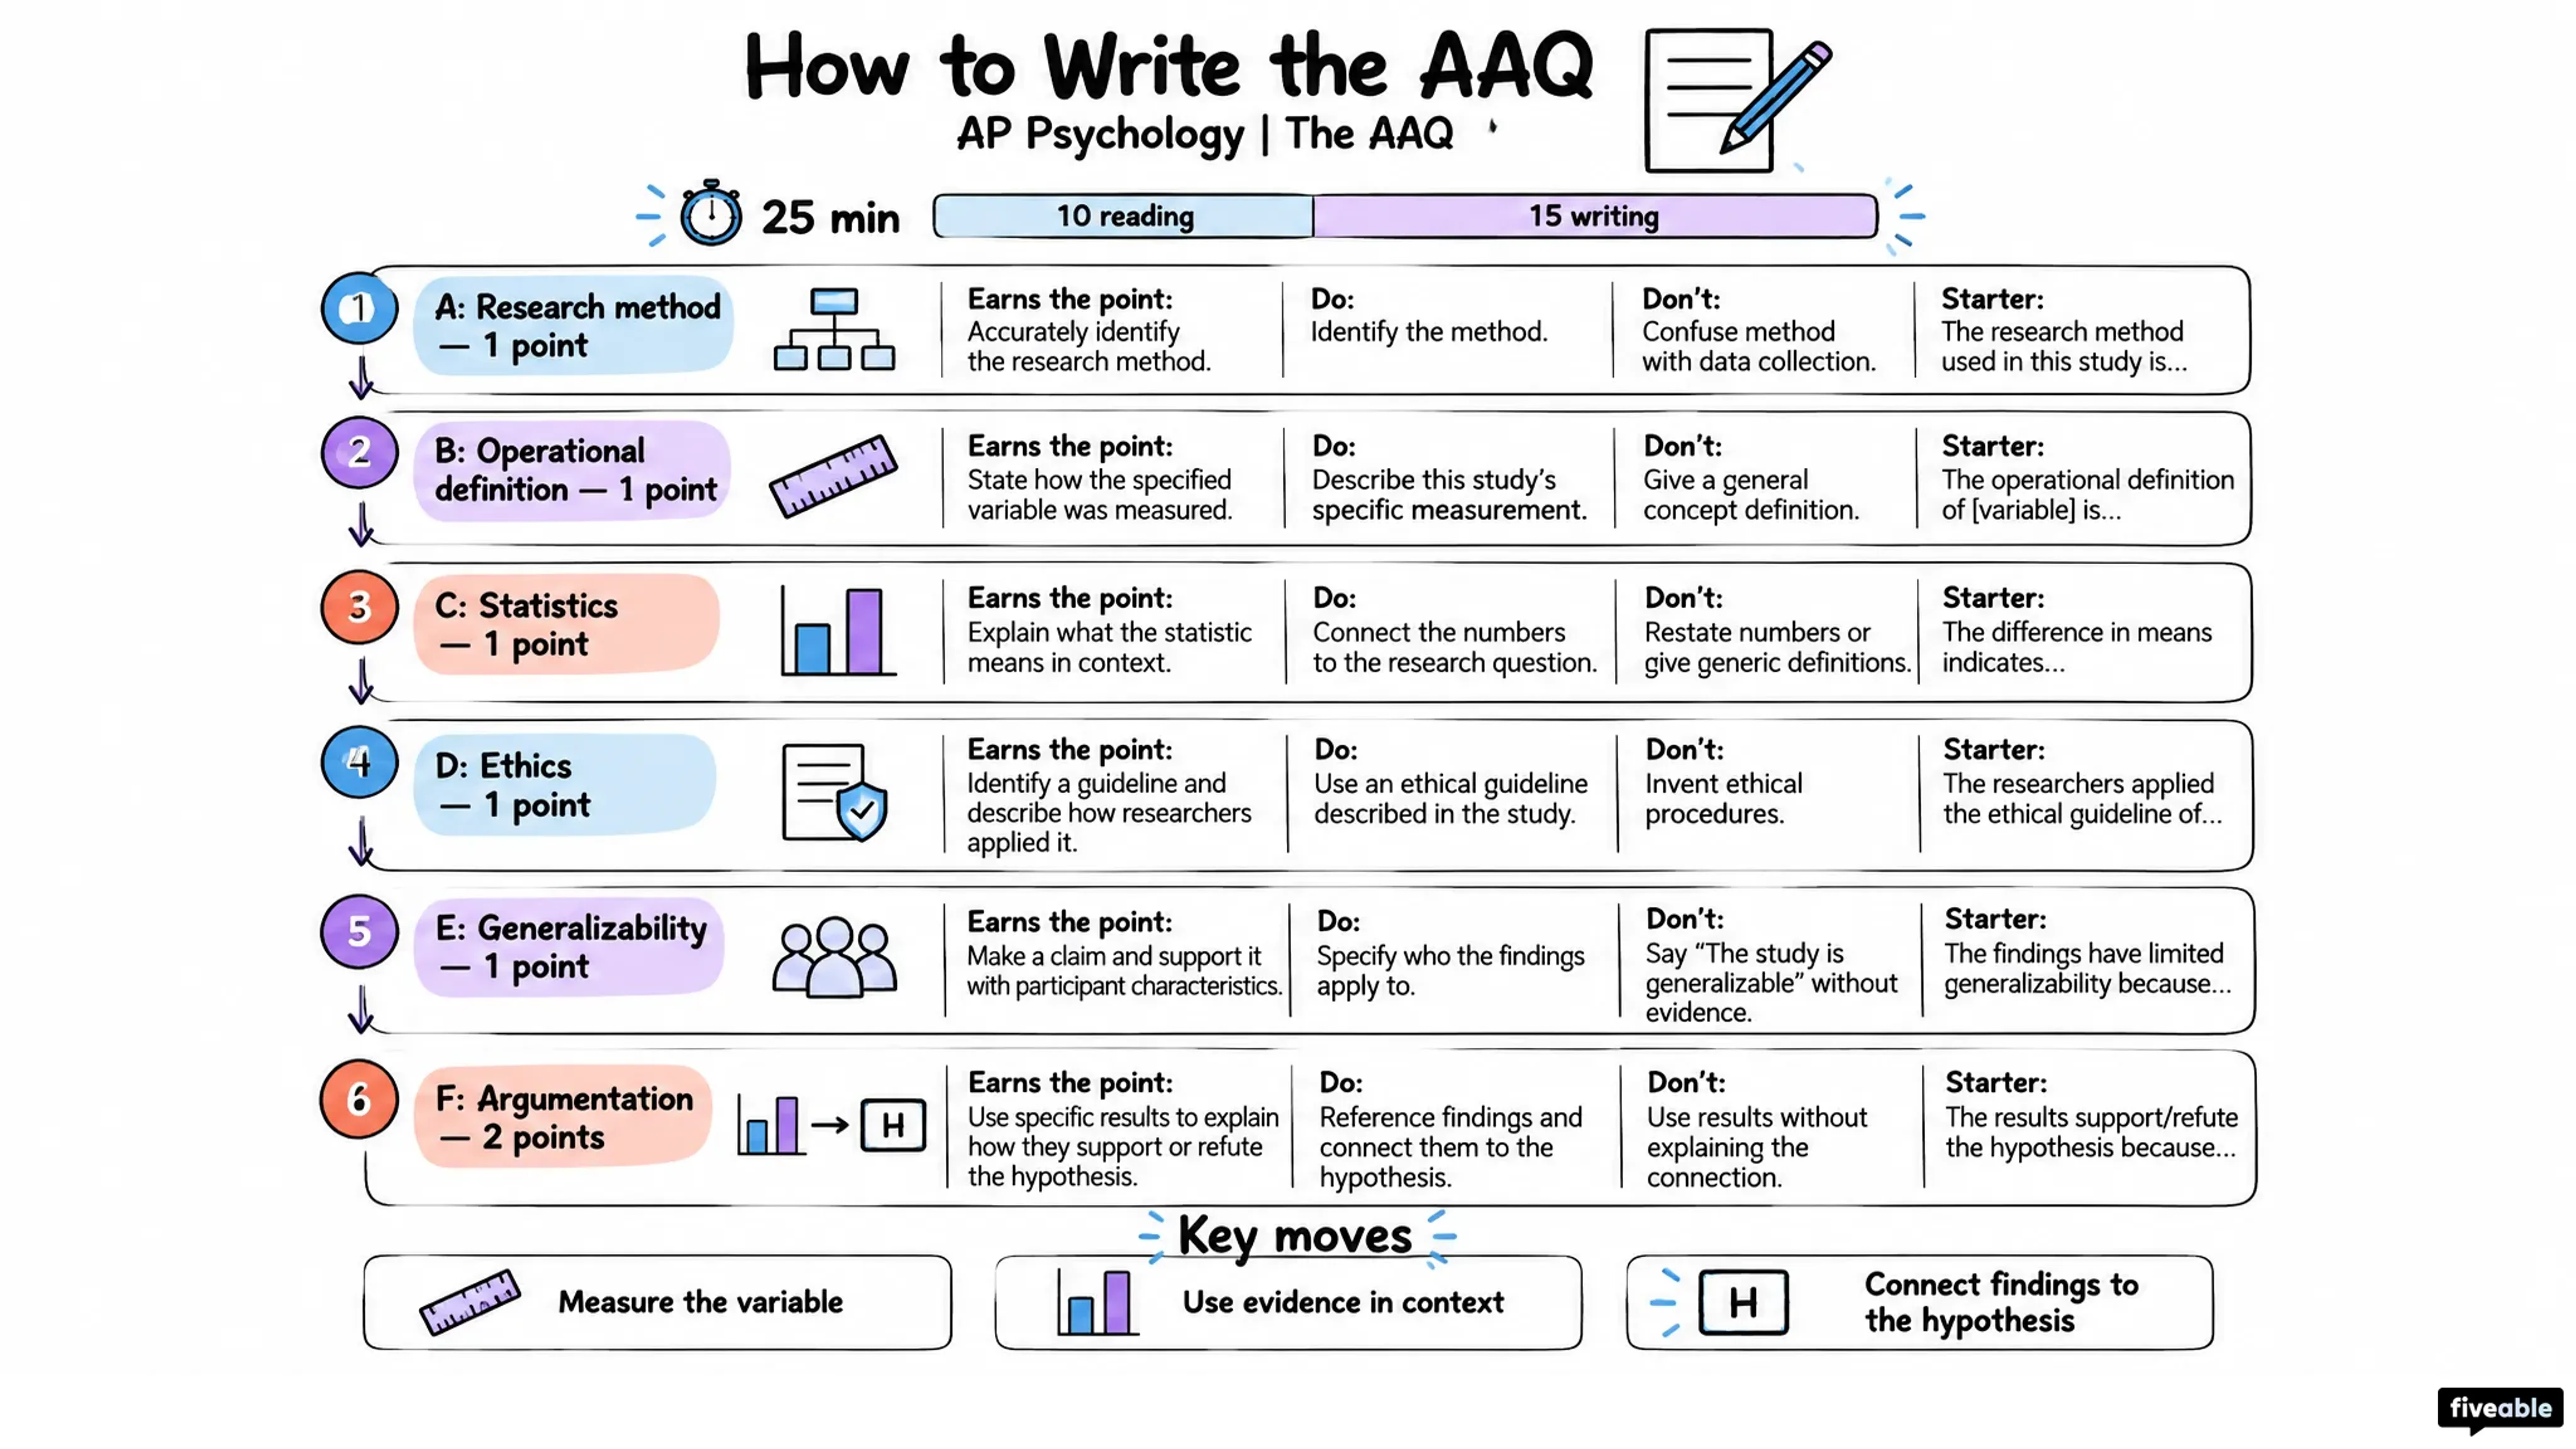
The Article Analysis Question is FRQ 1 on the AP Psychology exam. You get a summary of a real, published study, with its methods, participants, and results, and answer six parts about how the research works.
- 25 min
- 10 reading, 15 writing
- 7 points
- across parts A to F
- 16.65%
- of your exam score
Part A: Research method
Experiment, correlational study, or another design
1 pt
Part B: Operational definition
How the researchers measured a variable
1 pt
Part C: Statistics
What a result means in context, with no calculation
1 pt
Part D: Ethics
A guideline the study followed and how it was applied
1 pt
Part E: Generalizability
Who the findings apply to, based on the sample
1 pt
Part F: Argumentation
Whether a finding supports or refutes a psychological concept
2 pts
AAQ skill sheet
Every rubric point on one page: what earns it, what to do and what to avoid. Tap the sheet to see it full size.
How AAQ practice works
Each question follows the exam’s format, from the full prompt to a score on every part.
Read the full question
The study summary and all six parts, A through F, laid out the way the exam shows them.
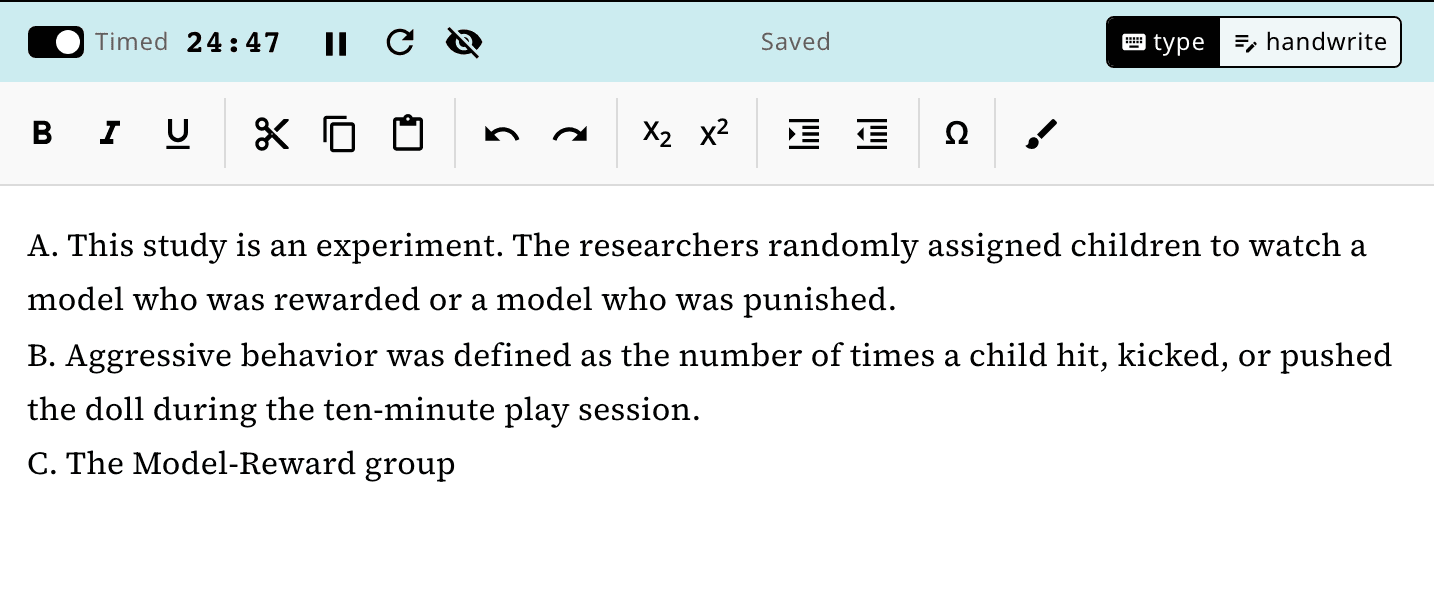
Write on a 25-minute timer
The time to plan for on exam day. Pause it or turn it off, and your response saves as you go.
Submit for a score out of 7
Your response is scored against the scoring guidelines written for that question. Your first score is included.
Feedback on every part
A summary at the top tells you what to work on next. Below it, each part shows whether you earned the point and what the scoring guidelines were looking for.
Detailed Feedback
Part A: 1/1 point
You correctly identified naturalistic observation.
Part B: 0/1 point
You named sharing and helping, but you did not state that researchers counted or measured those behaviors.
Part C: 1/1 point
You correctly explained that girls averaged more prosocial acts than boys.
What 866 scored AAQs show
Patterns from the practice AAQs students have turned in on Fiveable. Students lose the most points on Part F: argumentation.
D: Ethics
85%
E: Generalizability
79%
A: Research method
76%
B: Operational definition
74%
C: Statistics
68%
F: Argumentation
57%
Experiment
91%
Naturalistic observation
86%
Case study
83%
Cross-sectional
76%
Correlational
73%
Longitudinal
61%
Survey
60%
28%
of responses earned all 7 points
5 of 7
average score
+1.4 points
average gain when students rewrote the same AAQ after feedback
866 practice responses from 410 students, scored on Fiveable through October 25, 2026.
Questions about the AAQ
How many responses can I get scored?
You can read every question without a plan. Your first scored response is included. A plan unlocks unlimited scoring.
What does the article look like?
A summary of a published study: its methods, who took part, the results, and basic statistics. You don’t need to know the study ahead of time.
How is the AAQ different from the EBQ?
The AAQ asks about one study and its research methods. The EBQ asks you to build an argument from three sources, and the exam gives it 45 minutes.
Are these real College Board questions?
No. We wrote them in the AP format, with the same six parts, and wrote scoring guidelines for each one.
Can I write my answer by hand?
Yes. Switch the editor to handwrite, write on paper, and add a photo of your page.
More AP Psychology practice
See the AAQ rubric points students miss most, from responses scored on Fiveable.
Write your first AAQ
Pick one from the list, or let us choose for you.
Teaching AP Psychology? Assign these AAQs to your class