AP Comparative Government Quantitative Analysis FRQ Practice
118 Quantitative Analysis questions written in the AP format. Pick one, read the data and all five parts, and write your response.
Your first scored response is included. A plan unlocks unlimited scoring.
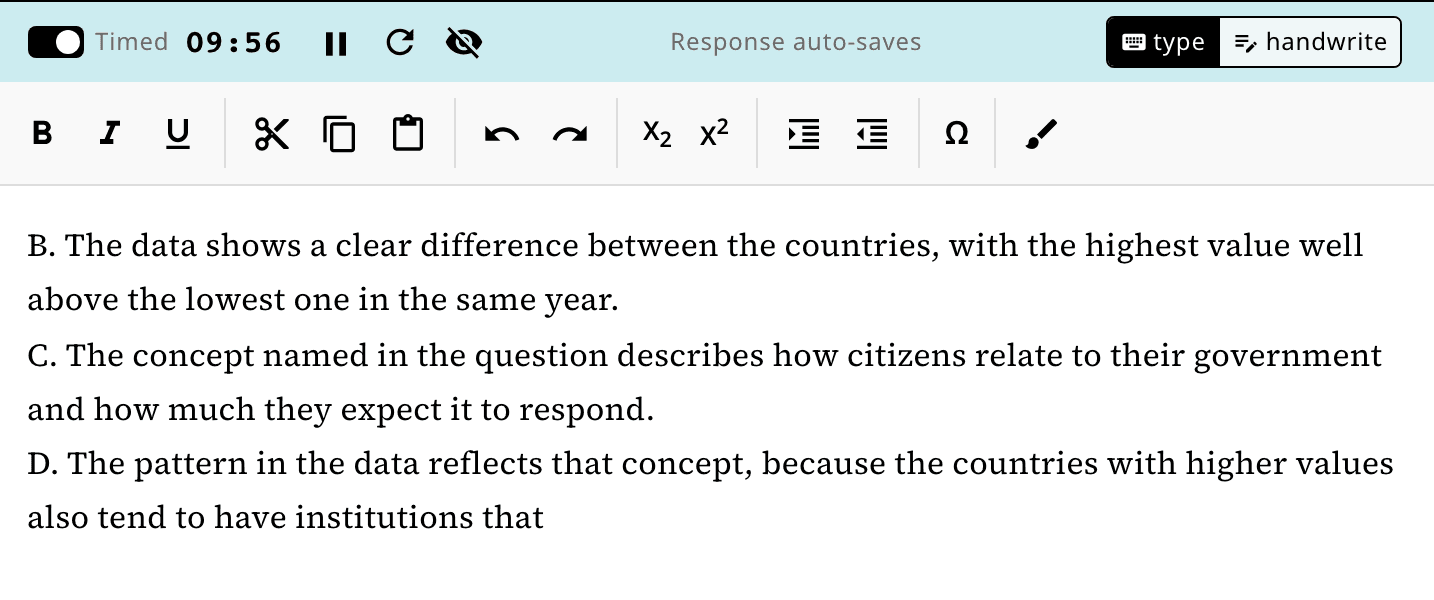
118 questions
sorted by unit
Control of corruption trends across nations
Unit 1: Political Systems, Regimes, and Governments
Respond to parts A, B, C, D, and E.
Using the data in the table, identify the country with the lowest control of corruption percentile rank in 2000.
Using the data in the table, describe a trend in Mexico's control of corruption percentile rank between 2000 and 2023.
Describe political legitimacy.
Using the data in the table, draw a conclusion that explains the change in China's control of corruption percentile rank between 2010 and 2023.
Explain how Russia's control of corruption percentile rank relates to its regime type.
What the Quantitative Analysis FRQ asks
The Quantitative Analysis question is FRQ 2 on the AP Comparative Government exam. You get a table, graph, map, or infographic about the course countries and answer five parts that move from reading the data to explaining what it shows.
- 20 min
- suggested writing time
- 5 points
- across parts A to E
- 12.5%
- of your exam score
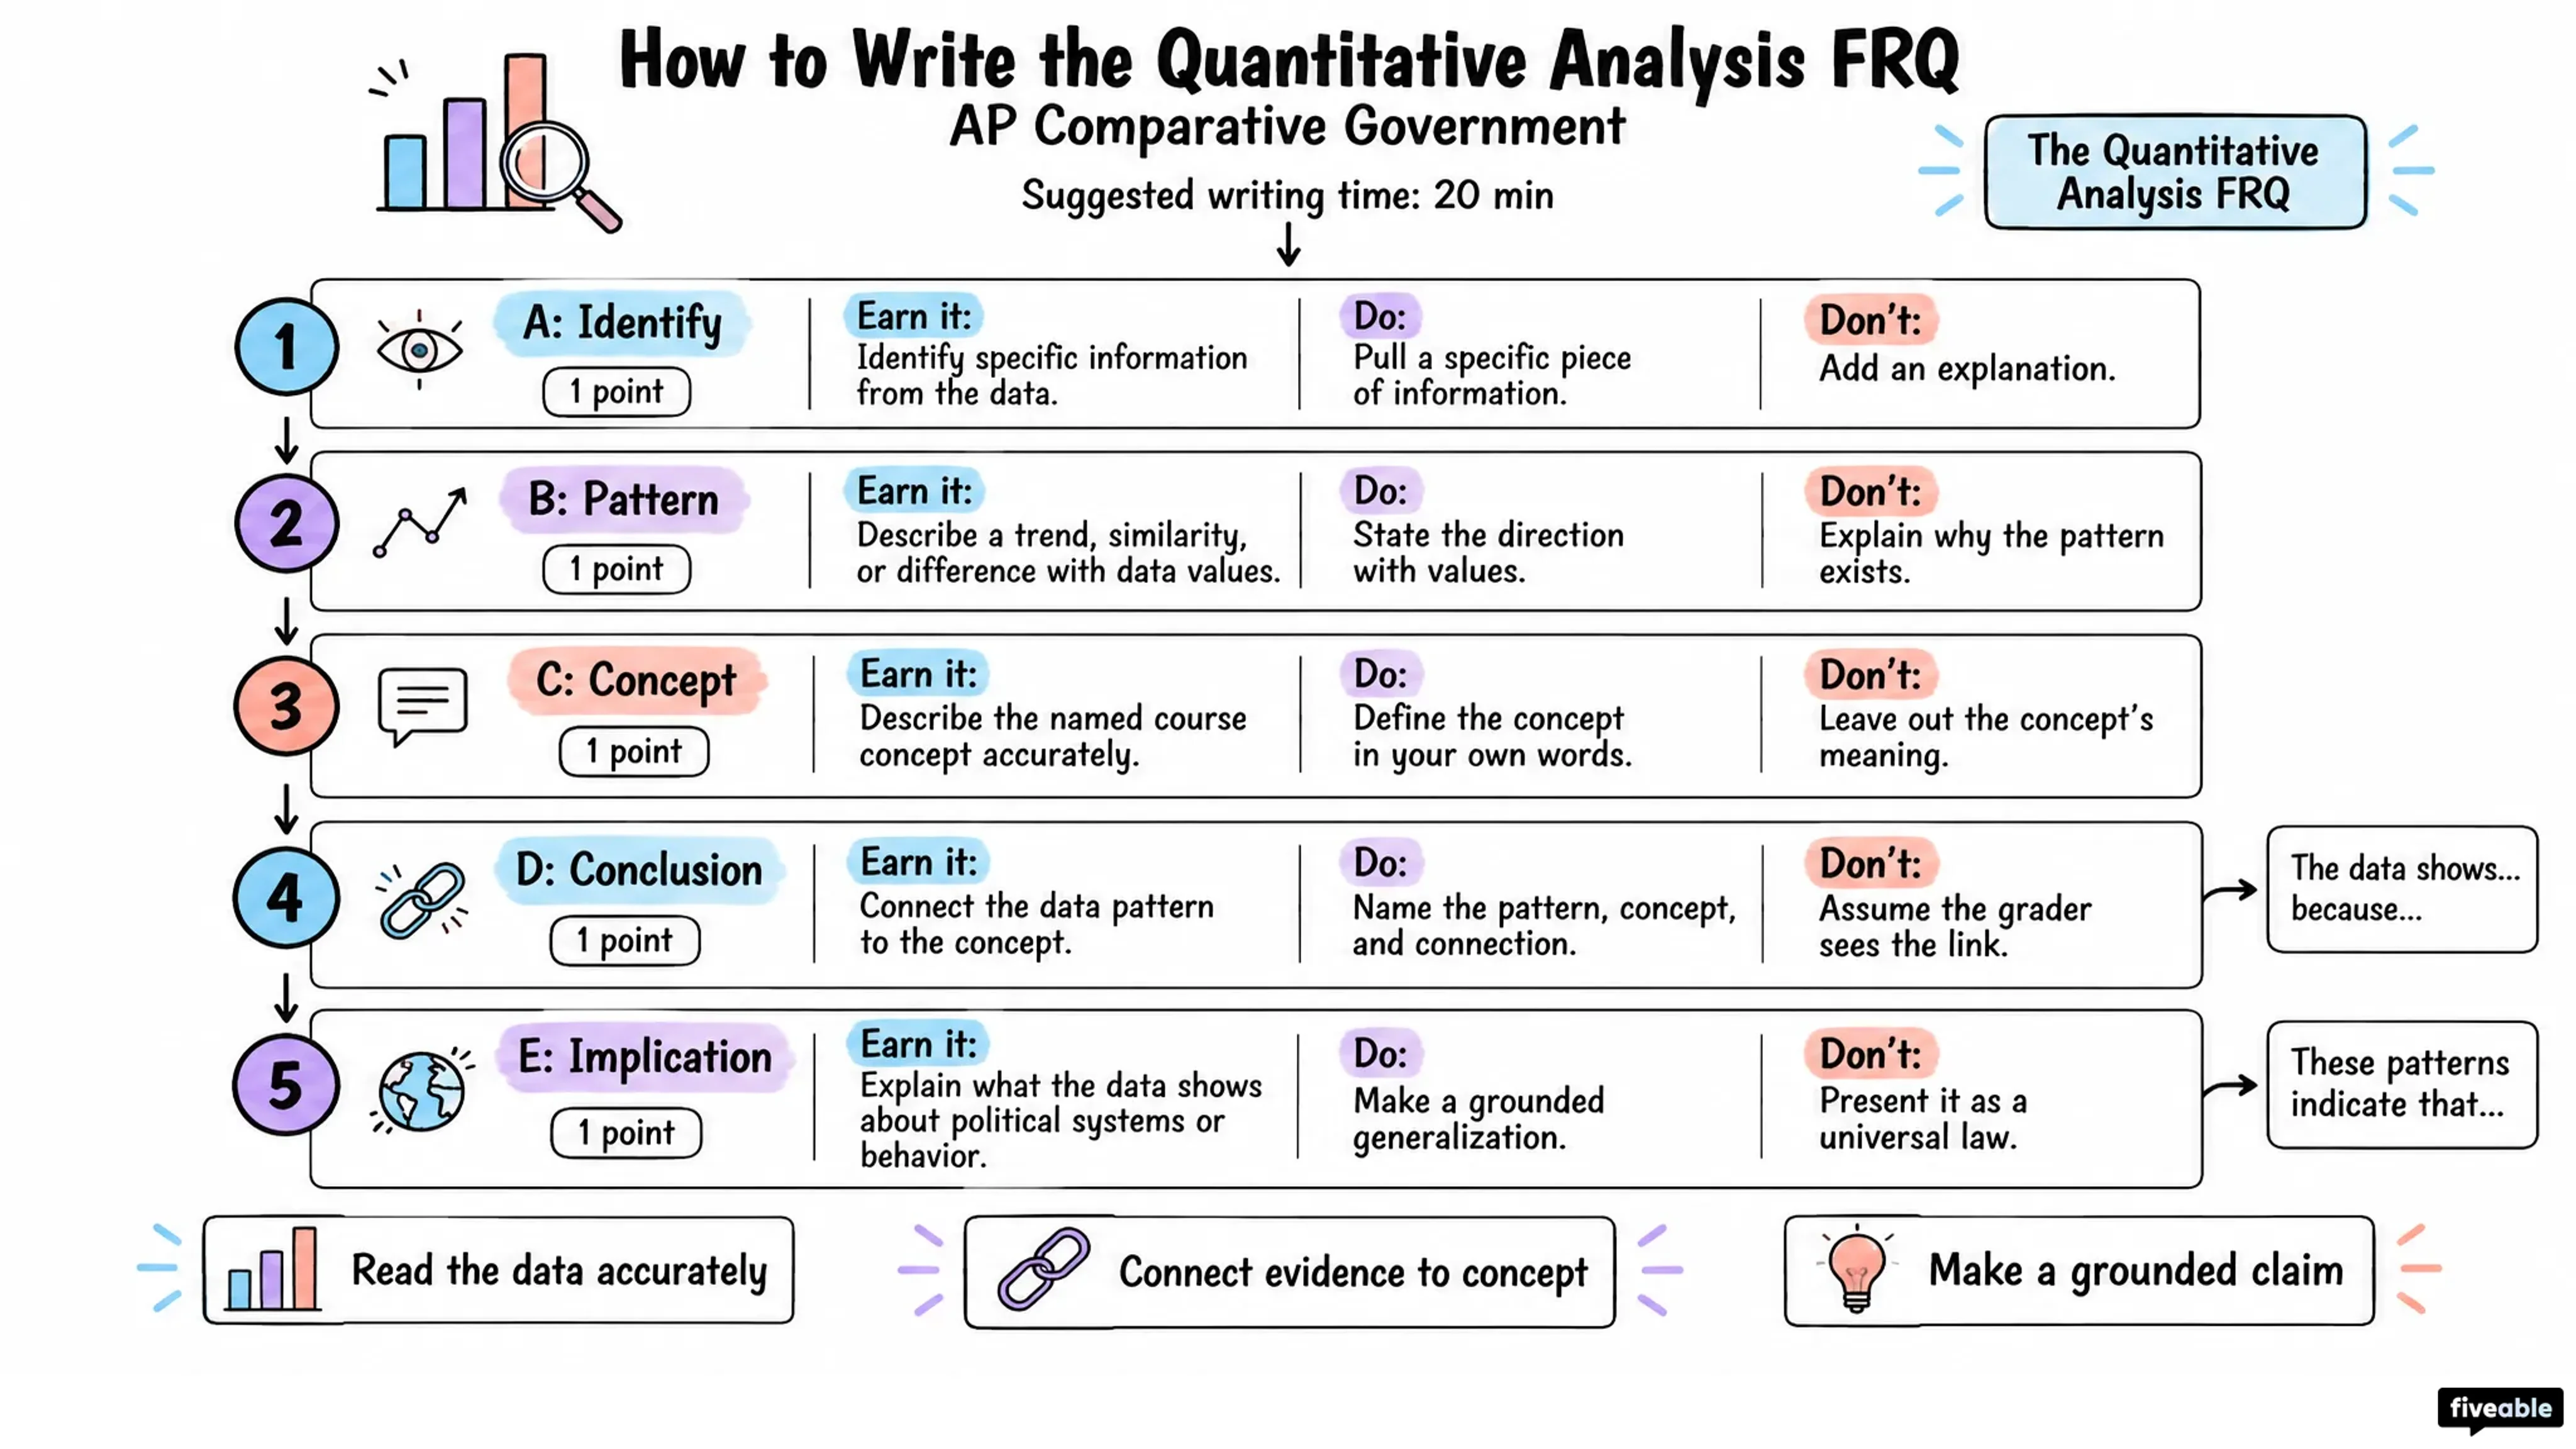
Part A: Identify
A specific piece of information from the data
1 pt
Part B: Pattern
A trend, similarity, or difference, with values from the data
1 pt
Part C: Concept
The course concept the question names, described accurately
1 pt
Part D: Conclusion
A conclusion that explains the data using that concept
1 pt
Part E: Implication
What the data shows about political systems or behavior
1 pt
Quantitative Analysis FRQ skill sheet
Every rubric point on one page: what earns it, what to do and what to avoid. Tap the sheet to see it full size.
How Quantitative Analysis FRQ practice works
Each question follows the exam’s format, from the full prompt to a score on every part.
Read the data and the question
The table, graph, or map and all five parts, A through E, laid out the way the exam shows them.
Write on a 20-minute timer
The time to plan for on exam day. Pause it or turn it off, and your response saves as you go.
Submit for a score out of 5
Your response is scored against the scoring guidelines written for that question. Your first score is included.
Feedback on every part
A summary at the top tells you what to work on next. Below it, each part shows whether you earned the point and what the scoring guidelines were looking for.
Detailed Feedback
Part A: 1/1 point
Earned the point. You correctly identified Nigeria as the country with the lowest control of corruption percentile rank in 2000.
Part B: 0/1 point
Did not earn the point. While you correctly identified the numbers 54.8 and 17.5, you misinterpreted what they mean. The table shows the "Control of Corruption Percentile Rank," where a higher number means better control. Because Mexico's number decreased from 54.8 to 17.5, their control of corruption got worse, not better. To earn the point, you needed to state that Mexico's control of corruption percentile rank decreased or declined.
Part C: 1/1 point
Earned the point. You correctly described political legitimacy by defining it as the citizens' belief that the government has the right to rule.
What 278 scored Quantitative Analysis FRQs show
Patterns from the practice Quantitative Analysis FRQs students have turned in on Fiveable. Students lose the most points on Part E: implication.
A: Identify
87%
B: Pattern
82%
C: Concept
76%
D: Conclusion
64%
E: Implication
57%
33%
of responses earned all 5 points
3.7 of 5
average score
+1.1 points
average gain when students rewrote the same Quantitative Analysis FRQ after feedback
278 practice responses from 106 students, scored on Fiveable through October 11, 2026.
Questions about the Quantitative Analysis FRQ
How many responses can I get scored?
You can read every question without a plan. Your first scored response is included. A plan unlocks unlimited scoring.
Do I need to do any math?
No. You read the data and describe what it shows. There are no formulas or calculations.
How is Part D different from Part B?
Part B describes what the data shows. Part D draws a conclusion that explains the data using the course concept from Part C.
Are these real College Board questions?
No. We wrote them in the AP format, with the same five parts, and wrote scoring guidelines for each one.
Can I write my answer by hand?
Yes. Switch the editor to handwrite, write on paper, and add a photo of your page.
More AP Comparative Government practice
Conceptual Analysis FRQ practice
Conceptual Analysis questions with all four parts, A through D.
Comparative Analysis FRQ practice
Comparative Analysis questions with all three parts and two course countries.
Argument Essay practice
Argument Essays with the full prompt and its provided course concepts.
AP Comparative Government FRQs
Every FRQ type for AP Comparative Government, with practice for each.
Write your first Quantitative Analysis FRQ
Pick one from the list, or let us choose for you.
Teaching AP Comparative Government? Assign these Quantitative Analysis FRQs to your class