⚗️Analytical Chemistry Unit 2 Review
2.2 Accuracy, precision, and error analysis
2.2 Accuracy, precision, and error analysis
Unit & Topic Study Guides
Introduction to Analytical Chemistry
Chemical Analysis: Measurements & Data
Sample Preparation and Handling
Gravimetric and Titrimetric Analysis
Spectroscopic Methods
Separation Techniques
Electroanalytical Methods
Mass Spectrometry
Thermal Analysis
Automated and Computerized Systems
Quality Assurance and Control in Chemistry
Accuracy and Precision in Measurements
Defining Accuracy and Precision
Accuracy refers to how close a measured value is to the true value of the quantity being measured. Precision refers to the degree of agreement among replicate measurements of the same quantity. These two concepts are independent of each other, which is a point that trips up a lot of students.
A measurement can be accurate but not precise, precise but not accurate, neither, or both. The goal in analytical chemistry is always to achieve both.
Relationship Between Accuracy and Precision
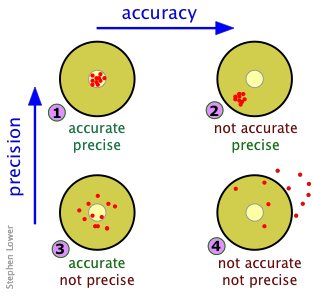
Think of a dartboard analogy. Each combination tells you something different about what's going wrong (or right) with your measurements:
- High accuracy and high precision: Measurements cluster tightly around the true value. This is the ideal scenario.
- High accuracy but low precision: Measurements scatter widely, but their average lands near the true value. This may point to inconsistent technique or noisy instrumentation.
- Low accuracy but high precision: Measurements cluster tightly, but they're consistently off from the true value. This is the hallmark of a systematic error shifting all your results in one direction.
- Low accuracy and low precision: Measurements scatter widely and miss the true value. Something is seriously wrong with the measurement process.
Recognizing which combination you're dealing with tells you what kind of problem to fix: precision issues call for better technique and more replicates, while accuracy issues call for recalibration or method correction.
Sources of Measurement Errors
Systematic Errors
Systematic errors are consistent, reproducible inaccuracies that shift all measurements in the same direction. They affect accuracy, not precision. Because every measurement is shifted the same way, they can be hard to detect just by looking at your data's spread.
Common causes include:
- Instrumental drift: Gradual change in instrument response over time (e.g., a pH meter slowly losing calibration during a long run of samples)
- Calibration errors: Inaccuracies in the calibration standards themselves, or an improperly constructed calibration curve
- Biased sampling: Non-representative sample collection or preparation that consistently skews results in one direction
The key challenge with systematic errors is that taking more measurements won't help. You need to identify and eliminate the source, for example by recalibrating instruments, using certified reference materials, or changing your sampling procedure.
Random Errors
Random errors are unpredictable fluctuations that cause measurements to scatter around a central value. They affect precision. Unlike systematic errors, random errors are equally likely to make a result too high or too low.
Common causes include:
- Instrumental noise: Background fluctuations in detector signals or electronic components
- Variations in sample preparation: Small inconsistencies in pipetting volumes, dilution steps, or extraction efficiency
- Environmental fluctuations: Changes in temperature, humidity, or pressure during a measurement session
Random errors can be reduced by increasing the number of replicate measurements. As you average more data points, the random fluctuations tend to cancel out, and your mean gets closer to the true value.

Other Sources of Error
- Human errors (gross errors): Mistakes like misreading a buret, transposing digits when recording data, or using the wrong pipette. These are blunders rather than statistical errors, and they should be identified and discarded rather than averaged in.
- Method errors: Limitations inherent to the analytical method itself, such as incomplete chemical reactions, co-extraction of interfering species, or matrix effects that suppress or enhance the analyte signal.
- Sampling errors: Problems arising during sample collection, transport, or storage, such as contamination from containers or analyte degradation before analysis.
Absolute vs. Relative Errors
Absolute Error
Absolute error is the straightforward difference between your measured value and the true value. It carries the same units as the measurement itself.
Example: If the true concentration of a sample is 10.0 ppm and you measure 9.5 ppm, the absolute error is . The negative sign tells you the measurement was below the true value.
Relative Error
Relative error expresses the absolute error as a fraction (or percentage) of the true value. This is more useful than absolute error when you need to compare the quality of measurements across different scales or units.
Example: Using the values above:
A Note on Percent Error
You'll sometimes see "percent error" listed as a separate quantity, but in practice it's the same calculation as relative error expressed as a percentage. The formula above already gives you the percent error. Some textbooks define percent error using the absolute value of the numerator (ignoring the sign), so check which convention your course uses.
Interpreting Errors
- A positive error means the measured value is higher than the true value; a negative error means it's lower.
- The magnitude (absolute value) of the error tells you how large the discrepancy is, regardless of direction.
- Relative and percent errors are especially valuable for comparing measurements at different concentration levels. An absolute error of 0.5 ppm is much more concerning when the true value is 1.0 ppm (50% error) than when it's 100.0 ppm (0.5% error).
Assessing Measurement Accuracy and Precision
Statistical Techniques for Accuracy Assessment
The mean (average) of replicate measurements serves as your best estimate of the true value:
where represents each individual measurement and is the total number of measurements. The closer is to the accepted true value, the more accurate your method.
Confidence intervals extend this idea by providing a range within which the true value is expected to fall at a given probability level (commonly 95%). They're calculated using the mean, the standard deviation, and a critical value from the Student's t-distribution. A narrower confidence interval indicates better accuracy for a given confidence level.
Statistical Techniques for Precision Assessment
The standard deviation quantifies how spread out your replicate measurements are:
Note the in the denominator. This is called Bessel's correction, and it accounts for the fact that you're estimating the population standard deviation from a sample. A smaller means better precision.
The relative standard deviation (RSD), also called the coefficient of variation (CV), expresses precision as a percentage of the mean:
RSD is particularly useful for comparing precision across measurements at different concentration levels or in different units.
Comparing Accuracy and Precision of Analytical Methods
Statistical hypothesis tests let you make rigorous comparisons between methods or against performance criteria:
- t-test: Compares the means of two data sets to determine whether they differ significantly. Use this to check whether your method's mean agrees with a known reference value, or whether two methods give the same result.
- F-test: Compares the variances () of two data sets to determine whether one method is significantly more precise than another.
- ANOVA (Analysis of Variance): Extends the comparison to three or more data sets simultaneously, testing whether any of the group means differ significantly from each other.
Method Validation
Before an analytical method is used for real samples, it needs to be validated. Validation confirms the method is fit for its intended purpose by evaluating several performance characteristics:
- Accuracy: Analyze samples with known concentrations (e.g., certified reference materials) and compare measured values to true values.
- Precision: Analyze replicate samples and calculate the standard deviation or RSD. Repeatability (same analyst, same day) and reproducibility (different analysts, different days) are both assessed.
- Sensitivity: Determine the limit of detection (LOD), the lowest concentration that can be reliably distinguished from a blank, and the limit of quantitation (LOQ), the lowest concentration that can be measured with acceptable precision.
- Selectivity: Evaluate whether the method can accurately measure the target analyte in the presence of potential interferences from the sample matrix.
- Robustness: Test the method's performance under deliberately varied conditions (different instruments, analysts, temperatures, etc.) to ensure small changes don't compromise results.