Bivariate and multivariate distributions help us understand how multiple random variables interact. They're crucial for analyzing complex systems where outcomes depend on multiple factors, like how height and weight relate or how education impacts income.
These distributions let us calculate probabilities for specific combinations of variables. We can also find marginal and conditional probabilities, giving us a deeper understanding of how variables influence each other in real-world scenarios.
Foundations of Bivariate and Multivariate Distributions
Joint probability distributions
- Joint probability distribution describes probability of two or more random variables occurring simultaneously (coin flip and die roll)
- Discrete joint probability distribution represented by joint probability mass function (PMF) denoted as for two variables (number of heads in coin flips and sum of dice rolls)
- Continuous joint probability distribution represented by joint probability density function (PDF) denoted as for two variables (height and weight of individuals)
- Interpretation describes relationship between multiple random variables allows calculation of probabilities for specific combinations of values
Bivariate and multivariate probabilities
- Marginal distributions obtained by summing or integrating over one variable
- For discrete: (probability of getting a specific number of heads regardless of dice roll)
- For continuous: (probability density of height regardless of weight)
- Conditional distributions probability of one variable given a specific value of another
- For discrete: (probability of dice sum given 3 heads in coin flips)
- For continuous: (probability density of weight given a specific height)
- Deriving joint PMF or PDF from given information about relationship between variables using transformation techniques for known distributions
Properties of multivariate distributions
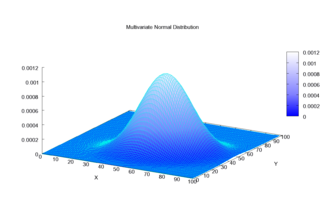
- Bivariate normal distribution joint PDF:
- Parameters: means (), standard deviations (), correlation coefficient ()
- Properties of bivariate normal distribution:
- Marginal distributions univariate normal
- Conditional distributions normal
- Uncorrelated variables independent
- Other common multivariate distributions:
- Multinomial distribution models probability of different outcomes in multiple trials (rolling dice multiple times)
- Dirichlet distribution continuous multivariate generalization of beta distribution (modeling proportions of different components in a mixture)
Visualization of multivariate data
- Scatter plots display relationship between two variables useful for identifying patterns, correlations, and outliers (height vs weight)
- Contour plots represent 3D surface on 2D plane show lines of constant probability density for bivariate distributions (bivariate normal distribution)
- Heat maps visualize joint distribution of two discrete variables color intensity represents probability or frequency (contingency table for education level and income)
- Pair plots matrix of scatter plots for multiple variables useful for exploring relationships in multivariate data (comparing multiple physical characteristics)
- 3D surface plots visualize joint PDF for two continuous variables height represents probability density (bivariate normal distribution)