KPIs for Multinational Performance
Key Performance Indicators (KPIs) give multinational companies a way to measure how well they're performing across countries, regions, and business units. Without standardized metrics, headquarters has no reliable way to compare a subsidiary in Brazil against one in Germany. KPIs solve this by creating a shared language for performance, covering everything from financial returns to employee morale.
The real challenge isn't picking KPIs. It's adapting them so they remain meaningful across different cultures, economies, and regulatory environments while still allowing apples-to-apples comparison at the global level.
Financial and Non-Financial KPIs
Financial KPIs measure the quantitative health of global operations. These are the metrics most executives look at first:
- Return on Investment (ROI) evaluates how efficiently capital is deployed across markets. A subsidiary with 18% ROI in India versus 9% in France tells you something, but only after you account for local risk and cost of capital.
- Profit Margin indicates profitability region by region. Margins that look weak in one country may actually be strong relative to local competitors.
- Revenue Growth Rate tracks how fast the company is expanding in each country or region.
- Cash Flow from Operations assesses whether subsidiaries are generating enough liquidity to sustain themselves without constant transfers from headquarters.
Non-financial KPIs capture qualitative factors that drive long-term sustainability:
- Customer Satisfaction Index gauges how well the company meets client expectations in diverse markets. A score of 85 in one country may reflect different underlying expectations than the same score elsewhere.
- Employee Engagement Score measures workforce motivation, which varies significantly across cultures.
- Market Share reflects competitive positioning within specific national or regional markets.
- Brand Equity assesses how strong and recognizable the brand is in each region.
Operational KPIs evaluate the efficiency of global supply chains and production:
- On-Time Delivery Rate tracks shipment punctuality worldwide.
- Inventory Turnover measures how efficiently stock is managed across different markets.
- Capacity Utilization assesses how well international facilities are using their available resources.
Innovation KPIs signal whether the company is investing in future competitiveness:
- New Product Development Success Rate measures how effectively R&D translates into viable products across markets.
- R&D Spend as Percentage of Revenue reflects the company's commitment to innovation relative to its size.
Sustainability KPIs reflect environmental and social responsibility commitments:
- Carbon Footprint Reduction tracks progress toward emissions targets.
- Percentage of Sustainable Sourcing measures how much procurement follows responsible practices.
The Balanced Scorecard Approach
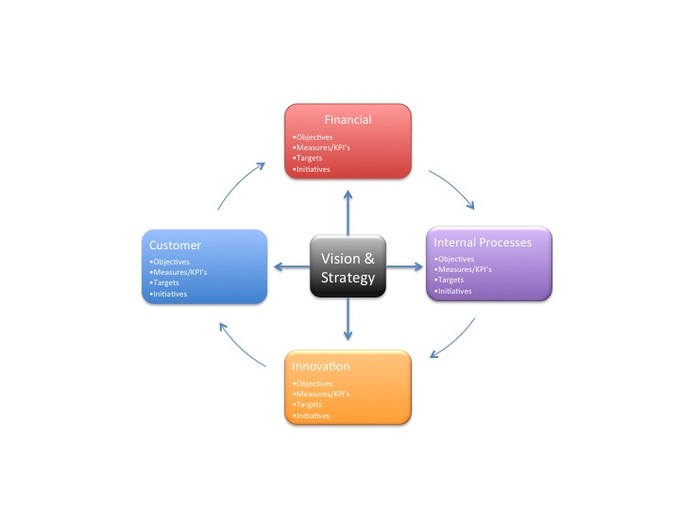
The Balanced Scorecard is the most widely used framework for integrating these different KPI categories. It organizes metrics across four perspectives so that no single dimension dominates decision-making:
- Financial Perspective covers profitability, growth, and shareholder value metrics.
- Customer Perspective focuses on satisfaction, retention, and market position.
- Internal Business Processes Perspective evaluates operational efficiency and quality.
- Learning and Growth Perspective assesses innovation capacity, employee development, and organizational knowledge.
The value of this framework for multinationals is that it forces managers to look beyond short-term financial results. A subsidiary might post strong quarterly profits while losing market share and burning out employees. The Balanced Scorecard makes those trade-offs visible.
Adapting KPIs to Global Markets
Cultural and Economic Considerations
Cultural differences directly affect which KPIs matter and how they should be interpreted. Customer satisfaction metrics, for example, need to account for local expectations. In Japan, where gift-giving customs and service standards are deeply embedded in business relationships, satisfaction benchmarks look very different from those in the U.S. Similarly, employee engagement measures must align with cultural values. European subsidiaries may score differently on engagement surveys because work-life balance carries more weight there than in markets where long hours are the norm.
Economic context shapes financial KPIs just as much. You can't evaluate revenue growth in isolation without considering:
- GDP growth rates in the local market, which set the baseline for what "good" growth looks like
- Inflation rates, which can make nominal profit figures misleading if not adjusted
- Exchange rate fluctuations, which distort comparisons between regions unless you use constant-currency metrics
Regulatory and Market Factors
Regulatory environments often require their own compliance-related KPIs. In the EU, GDPR compliance metrics are non-negotiable. In California, emissions reporting standards create specific environmental KPIs that don't apply elsewhere. Ignoring these means risking fines and reputational damage.
Market maturity should drive KPI prioritization:
- In emerging markets, growth-focused metrics take priority. Market penetration rate and customer acquisition volume matter more than short-term profitability.
- In mature markets, the focus shifts to profitability and defending position. EBITDA margin and market share retention become the key indicators.
Competitive landscapes also require market-specific tracking. Local market share should be measured against regional competitors, not just global ones. Customer acquisition cost needs to be benchmarked against local industry norms, not company-wide averages.
Adaptation Process and Implementation
Adapting KPIs effectively requires a structured approach:
- Collaborate with local management teams through workshops that identify unique market challenges and opportunities. Local managers understand what drives performance in their context.
- Integrate local insights into the global KPI framework so that regional knowledge informs company-wide metrics rather than being overridden by them.
- Implement a tiered KPI system with three levels:
- Global metrics for company-wide performance assessment and board-level reporting
- Regional KPIs that address market-specific challenges (e.g., supply chain metrics for Asia-Pacific)
- Local metrics tailored to individual country operations and competitive conditions
This tiered structure lets headquarters maintain oversight while giving subsidiaries the flexibility to track what actually matters in their market.
Challenges of Defining KPIs Across Operations
Data and Reporting Challenges
Data consistency is one of the biggest headaches in global KPI management. Subsidiaries in different countries often use disparate systems that produce incompatible data formats. What one country calls "net revenue" might include or exclude different line items than another country's definition.
Language and cultural barriers compound the problem. Translation errors in metric definitions can lead to genuine misunderstandings about what's being measured. Cultural nuances also affect how people perceive performance targets: a stretch goal that motivates one team may demoralize another.
Time zone and calendar differences create logistical friction as well. Real-time data collection is difficult when operations span 12+ time zones. Fiscal year variations between countries (Japan's fiscal year starts in April, for instance) make period-based comparisons tricky.
Legal and Operational Complexities
Legal and regulatory compliance can directly limit what data you're allowed to collect. Some countries restrict gathering employee data, which constrains workforce KPIs. Financial reporting requirements vary across jurisdictions, meaning the same underlying performance may need to be reported differently.
Global supply chain complexity makes KPI attribution difficult. When multiple subsidiaries contribute to a single product's journey from raw material to customer delivery, isolating the performance of any one entity is genuinely hard. Allocating shared resources across regions for KPI calculations adds another layer of complexity.
Currency fluctuations deserve special attention. Financial KPIs need regular recalibration to ensure fair cross-border comparisons. Many multinationals use constant currency metrics, which strip out exchange rate movements to show underlying operational performance. Without this adjustment, a subsidiary could appear to be declining when it's actually growing in local-currency terms.
Technological and Infrastructure Issues
Technology gaps between developed and emerging markets create uneven KPI tracking capabilities. Subsidiaries in developed markets may have access to advanced analytics platforms, while those in emerging economies rely on manual processes or outdated tools.
Implementing a unified global KPI system faces two major technical hurdles:
- Legacy system integration: Connecting older, country-specific systems with modern KPI tracking platforms is expensive and time-consuming.
- Data security and privacy: Ensuring consistent protection standards across diverse IT environments, especially when data crosses borders, requires significant investment and coordination.
Effectiveness of KPIs in Driving Strategy
Strategic Alignment and Balance
KPIs only drive strategy if they're actually aligned with strategic objectives. This sounds obvious, but alignment erodes over time as strategy evolves while metrics stay static. Regular reviews of KPIs against current global objectives are essential, with adjustments made as priorities shift.
A well-designed KPI framework balances leading and lagging indicators:
- Leading indicators predict future performance and allow proactive management. Employee training hours, pipeline value, and customer inquiry volume are examples.
- Lagging indicators measure past results and confirm whether strategies worked. Annual revenue growth, yearly profit margin, and market share changes fall here.
Over-relying on lagging indicators means you're always looking in the rearview mirror. Over-relying on leading indicators means you're guessing without confirming results. You need both.
Correlation analysis helps identify which KPIs actually influence business outcomes. Statistical analysis can reveal that, say, employee engagement scores in a particular region strongly predict customer retention rates. This kind of insight lets companies refine their KPI set to focus on the metrics with the most impact.
Benchmarking and Feedback
Benchmarking KPI performance against industry standards gives context that internal data alone can't provide. Comparing results with global competitors highlights performance gaps and surfaces best practices worth adopting.
Stakeholder feedback is equally important. Surveys of regional managers can reveal which KPIs feel relevant and which feel like bureaucratic overhead. Focus groups with frontline employees help assess whether KPIs are actionable at the operational level. If the people responsible for hitting targets don't understand or believe in the metrics, those KPIs won't drive behavior.
Agility and Resource Optimization
A KPI framework that can't adapt to changing market conditions quickly becomes irrelevant. Regular review cycles (quarterly at minimum for fast-moving markets) keep metrics current. The framework should also have built-in flexibility to introduce new KPIs when emerging business priorities demand them, such as digital transformation metrics or pandemic-related resilience indicators.
Finally, companies should conduct cost-benefit analysis of their KPI measurement processes. Data collection and analysis consume real resources. If a particular KPI costs more to track than the performance improvement it generates, it's worth questioning whether that metric earns its place in the framework.