Hypotheses are the backbone of biostatistical research, guiding experimental design and data analysis. Null hypotheses represent the default position of no effect, while alternative hypotheses propose significant relationships or differences between variables.
Formulating clear, testable hypotheses is crucial for rigorous scientific inquiry. Understanding the nuances of hypothesis testing, including p-values, statistical significance, and common pitfalls, enables researchers to draw meaningful conclusions and advance biomedical knowledge.
Concept of hypotheses
- Hypotheses serve as foundational elements in biostatistical research by providing testable predictions about relationships between variables
- In biostatistics, hypotheses guide experimental design and data analysis, allowing researchers to draw meaningful conclusions about biological phenomena
Null hypothesis definition
- Represents the default position or no effect scenario in statistical testing
- States there is no significant difference or relationship between variables
- Often denoted as H₀, expresses the absence of an effect or association
- Assumes any observed differences result from random chance or sampling error
Alternative hypothesis definition
- Contradicts the null hypothesis and represents the research prediction
- Proposes a significant difference or relationship exists between variables
- Typically denoted as H₁ or Hₐ, suggests a non-random effect or association
- Can be directional (specifying the nature of the relationship) or non-directional
Importance in statistical testing
- Provides a framework for objective decision-making in research
- Allows quantification of evidence against the null hypothesis
- Facilitates standardized methods for analyzing and interpreting data
- Helps control for Type I and Type II errors in scientific conclusions
Formulating hypotheses
- Hypothesis formulation requires careful consideration of research questions and existing knowledge in biostatistics
- Well-constructed hypotheses guide the selection of appropriate statistical tests and interpretation of results
Characteristics of good hypotheses
- Clear and concise statements that can be tested empirically
- Based on existing theories or observations in the field of study
- Specific enough to be falsifiable through statistical analysis
- Addresses a single relationship or effect to avoid confounding factors
- Aligns with the research question and study design
Common hypothesis structures
- Comparison hypotheses examine differences between groups or conditions
- "Treatment A will result in a lower mean blood pressure than Treatment B"
- Correlation hypotheses investigate relationships between variables
- "There is a positive correlation between BMI and risk of type 2 diabetes"
- Predictive hypotheses propose causal relationships or outcomes
- "Increased physical activity will lead to improved cardiovascular health"
One-tailed vs two-tailed hypotheses
- One-tailed hypotheses specify a direction of effect (greater than or less than)
- Used when previous research suggests a specific directional relationship
- Provides more statistical power but limits detection of unexpected effects
- Two-tailed hypotheses test for any significant difference, regardless of direction
- More conservative approach, suitable when direction is uncertain
- Allows detection of effects in either direction, reducing bias
Null hypothesis specifics
- Null hypotheses play a crucial role in biostatistical inference by providing a baseline for comparison
- Understanding null hypotheses helps researchers interpret statistical results accurately
Purpose of null hypothesis
- Serves as a default position to be disproven by statistical evidence
- Allows for quantification of the probability of observing data by chance alone
- Provides a framework for controlling Type I errors (false positives)
- Facilitates the calculation of p-values and confidence intervals
Examples in biostatistics
- "There is no difference in survival rates between two cancer treatments"
- "The correlation between dietary fat intake and cholesterol levels is zero"
- "The incidence of a rare genetic disorder is equal across different populations"
- "There is no association between exposure to a specific environmental factor and disease risk"
Limitations of null hypothesis
- Cannot prove the absence of an effect, only fail to reject the null
- May lead to overlooking small but meaningful effects in large samples
- Does not provide information about the magnitude or practical significance of effects
- Can be misinterpreted as evidence for no effect rather than insufficient evidence

Alternative hypothesis details
- Alternative hypotheses represent the research predictions and guide the interpretation of statistical results
- Understanding different types of alternative hypotheses is crucial for proper study design and analysis
Types of alternative hypotheses
- Simple alternative hypotheses specify a single value or point estimate
- "The mean difference in blood pressure between groups is 10 mmHg"
- Composite alternative hypotheses encompass a range of possible values
- "The correlation between variables is not equal to zero"
- Precise alternative hypotheses state an exact magnitude of effect
- "Drug A will increase bone density by 5% compared to placebo"
Directional vs non-directional alternatives
- Directional alternatives specify the expected direction of effect
- "Treatment A will result in higher survival rates than Treatment B"
- Increases statistical power but requires strong prior evidence
- Non-directional alternatives test for any significant difference
- "There is a difference in efficacy between Treatment A and Treatment B"
- More conservative approach, suitable when direction is uncertain
Relationship to research question
- Alternative hypotheses should directly address the primary research question
- Guides the selection of appropriate statistical tests and study designs
- Influences the interpretation of results and conclusions drawn from the study
- Helps researchers communicate their expectations and findings clearly
Hypothesis testing process
- Hypothesis testing forms the backbone of statistical inference in biomedical research
- Understanding this process is essential for conducting and interpreting statistical analyses
Role of hypotheses in testing
- Provide a framework for systematic evaluation of research questions
- Guide the selection of appropriate statistical tests and methods
- Allow for quantification of evidence against the null hypothesis
- Facilitate standardized reporting and interpretation of results
Steps of hypothesis testing
- Formulate null and alternative hypotheses based on research question
- Choose an appropriate statistical test and significance level (α)
- Collect and analyze data, calculating test statistic and p-value
- Compare p-value to significance level to make a decision
- Interpret results in context of the original research question
- Draw conclusions and assess practical significance of findings
Decision making based on results
- Reject null hypothesis if p-value is less than significance level (α)
- Conclude there is sufficient evidence to support the alternative hypothesis
- Fail to reject null hypothesis if p-value is greater than or equal to α
- Conclude there is insufficient evidence to support the alternative hypothesis
- Consider practical significance alongside statistical significance
- Acknowledge limitations and potential sources of error in interpretation
Statistical significance
- Statistical significance plays a crucial role in hypothesis testing and decision-making in biostatistics
- Understanding the concepts of p-values, errors, and power is essential for proper interpretation of results
P-value interpretation
- Represents the probability of obtaining results as extreme as observed, assuming the null hypothesis is true
- Smaller p-values indicate stronger evidence against the null hypothesis
- Commonly used thresholds (0.05, 0.01) serve as decision points for rejecting the null
- Does not indicate the magnitude or practical importance of an effect
- Should be reported alongside effect sizes and confidence intervals for comprehensive interpretation
Type I and Type II errors
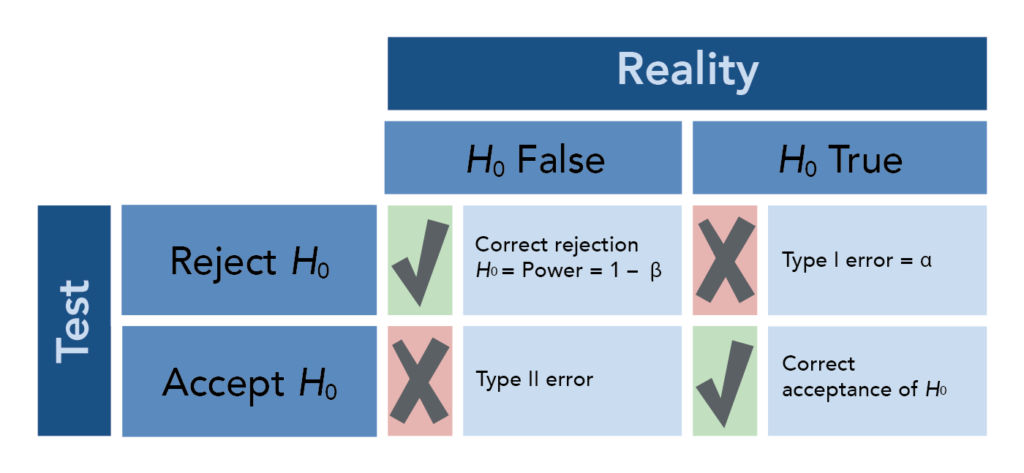
- Type I error (α) occurs when rejecting a true null hypothesis (false positive)
- Controlled by setting the significance level (typically 0.05 or 0.01)
- More serious in some contexts (drug approval, diagnostic tests)
- Type II error (β) occurs when failing to reject a false null hypothesis (false negative)
- Related to statistical power (1 - β)
- Influenced by sample size, effect size, and variability
- Trade-off exists between Type I and Type II errors in study design
Power of a test
- Probability of correctly rejecting a false null hypothesis (1 - β)
- Influenced by sample size, effect size, significance level, and variability
- Higher power increases the likelihood of detecting true effects
- Power analysis helps determine appropriate sample sizes for studies
- Typically aim for power of 0.80 or higher in biomedical research
Practical applications
- Hypotheses play a crucial role in various areas of biomedical research, guiding study design and interpretation
- Understanding how hypotheses are applied in different contexts enhances research skills and critical thinking
Hypotheses in clinical trials
- Efficacy hypotheses compare new treatments to standard care or placebo
- "The new drug will reduce HbA1c levels more than the current standard treatment"
- Safety hypotheses assess potential adverse effects or risks
- "The incidence of severe side effects will not differ between treatment groups"
- Non-inferiority hypotheses test if a new treatment is not worse than existing options
- "The new antibiotic is not inferior to the standard antibiotic in treating pneumonia"
Epidemiological study hypotheses
- Risk factor hypotheses examine associations between exposures and outcomes
- "Higher consumption of processed meat is associated with increased colorectal cancer risk"
- Prevalence hypotheses estimate disease occurrence in populations
- "The prevalence of asthma differs between urban and rural populations"
- Trend hypotheses investigate changes in disease patterns over time
- "The incidence of type 2 diabetes has increased over the past decade"
Genetic research hypotheses
- Association hypotheses link genetic variants to disease risk or traits
- "Specific SNPs in the BRCA1 gene are associated with increased breast cancer risk"
- Heritability hypotheses estimate genetic contributions to trait variation
- "The heritability of height is approximately 80% in the study population"
- Gene-environment interaction hypotheses examine combined effects
- "The effect of the FTO gene on BMI is moderated by physical activity levels"
Common mistakes
- Avoiding common errors in hypothesis formulation and interpretation is crucial for conducting rigorous biostatistical research
- Awareness of these pitfalls helps researchers improve study design and analysis
Misinterpretation of results
- Confusing statistical significance with practical importance
- Large samples can lead to statistically significant but clinically irrelevant results
- Overinterpreting p-values as measures of effect size or probability of hypothesis
- Failing to consider multiple comparisons and increased Type I error risk
- Ignoring effect sizes and confidence intervals when interpreting results
Inappropriate hypothesis formulation
- Creating vague or untestable hypotheses lacking specificity
- Formulating hypotheses after data collection (HARKing - Hypothesizing After Results are Known)
- Neglecting to consider alternative explanations for observed effects
- Failing to align hypotheses with the research question and study design
Overreliance on statistical significance
- Dichotomous thinking based solely on p-value thresholds (0.05)
- Ignoring trends or patterns in data that fail to reach significance
- Neglecting to report effect sizes and confidence intervals alongside p-values
- Failing to consider practical or clinical significance of findings
Advanced concepts
- Advanced hypothesis testing concepts enhance the sophistication and rigor of biostatistical analyses
- Understanding these topics allows researchers to address complex research questions and interpret results more accurately
Multiple hypothesis testing
- Occurs when testing multiple hypotheses simultaneously in a single study
- Increases the risk of Type I errors (false positives) due to chance
- Correction methods adjust p-values or significance levels
- Bonferroni correction divides α by the number of tests performed
- False Discovery Rate (FDR) controls the proportion of false positives
- Crucial in genomics and other high-dimensional data analyses
Bayesian vs frequentist approaches
- Frequentist approach (traditional)
- Based on long-run frequencies and p-values
- Treats parameters as fixed but unknown
- Widely used in biomedical research and clinical trials
- Bayesian approach
- Incorporates prior knowledge and updates beliefs with new data
- Provides probability distributions for parameters of interest
- Allows for more intuitive interpretation of results
- Gaining popularity in adaptive clinical trials and personalized medicine
Effect size and hypotheses
- Effect size quantifies the magnitude of the relationship or difference
- Complements hypothesis testing by providing practical significance
- Common effect size measures
- Cohen's d for standardized mean differences
- Odds ratios and relative risks for categorical outcomes
- Correlation coefficients for continuous relationships
- Helps in meta-analyses and power calculations for future studies
- Enables comparison of results across different scales or studies