AP Statistics Question 4 FRQ Practice
36 FRQ 4 questions written in the AP format. Pick one, read the full question, and write your response.
Your first scored response is included. A plan unlocks unlimited scoring.
36 questions
sorted by unit
Meteorite fragment mass distribution and outlier detection
Unit 1: Exploring One-Variable Data and Collecting Data
A geological research institute is studying meteorite fragments found in a 100-square-kilometer Antarctic ice field. The fragments are classified into two main types: chondrites and achondrites. The researchers want to analyze the mass, in grams, of these fragments to better understand their origins and distribution.
Mean | Standard Deviation | Minimum | Median | Maximum | |||
|---|---|---|---|---|---|---|---|
60 | 158 | 95 | 12 | 85 | 142 | 210 | 450 |
To estimate the mean mass of all meteorite fragments in the ice field, the researchers consider dividing the 100-square-kilometer area into 100 equal-sized grids of 1 square kilometer each. They plan to randomly select 5 of these grids and collect every meteorite fragment found within those 5 grids. Identify the sampling method proposed by the researchers. Explain one practical advantage of using this sampling method rather than selecting a simple random sample of fragments across the entire ice field.
The researchers collect a sample of 60 chondrite fragments. Summary statistics for the mass, in grams, of these fragments are shown in Table 1. Using the data in Table 1, determine whether the maximum mass of 450 grams is considered an outlier using the rule. Justify your answer with a statistical calculation.
A specific chondrite fragment from the sample has a mass of 450 grams. A separate sample of achondrite fragments has a mean mass of 110 grams and a standard deviation of 60 grams. A specific achondrite fragment from this separate sample has a mass of 380 grams. Calculate the standardized score (z-score) for each of these two fragments. Which fragment has a greater mass relative to its respective distribution?
Figure 1. Meteorite Fragment Masses (grams): boxplots for Chondrite (n = 60) and Achondrite (n = 50)
Figure 1 shows boxplots of the masses for the sample of 60 chondrite fragments and a sample of 50 achondrite fragments. Based on the boxplots, compare the distributions of mass for the two types of meteorite fragments.
The institute's directors will fund a larger follow-up expedition if the proposed sampling method from Part A is logistically efficient for large areas AND if there is statistical evidence that chondrite fragments typically have a greater mass than achondrite fragments. Based on your answers in Part A and Part D, should the directors fund the follow-up expedition? Justify your conclusion using evidence from BOTH previous parts.
What the Question 4 FRQ asks
FRQ 4 is the last of four FRQs on the AP Statistics exam, a multi-focus question on Practices 2, 3, and 4 that combines data collection, analysis, and interpretation. Its four or five parts often build on each other, and each question splits its 10 points its own way. The table shows an even split for reference, not the split on any one question.
- 10 points
- across four or five parts
- 12.5%
- of your exam score
- 90 min
- for all four FRQs
Part A: Identify
Name a method, statistic, or design feature
2 pts
Part B: Calculate
A probability, statistic, or test result, with work shown
2 pts
Part C: Interpret
What a result means in the context of the study
2 pts
Part D: Justify
Whether a claim is supported, using evidence from earlier parts
2 pts
Part E: Connect
A final decision that ties several parts together, when there is a fifth part
2 pts
How Question 4 FRQ practice works
Each question follows the exam’s format, from the full prompt to a score on every part.
Read the full question
The scenario, tables, and graphs, with every part laid out the way the exam shows them.
Write on a 22-minute timer
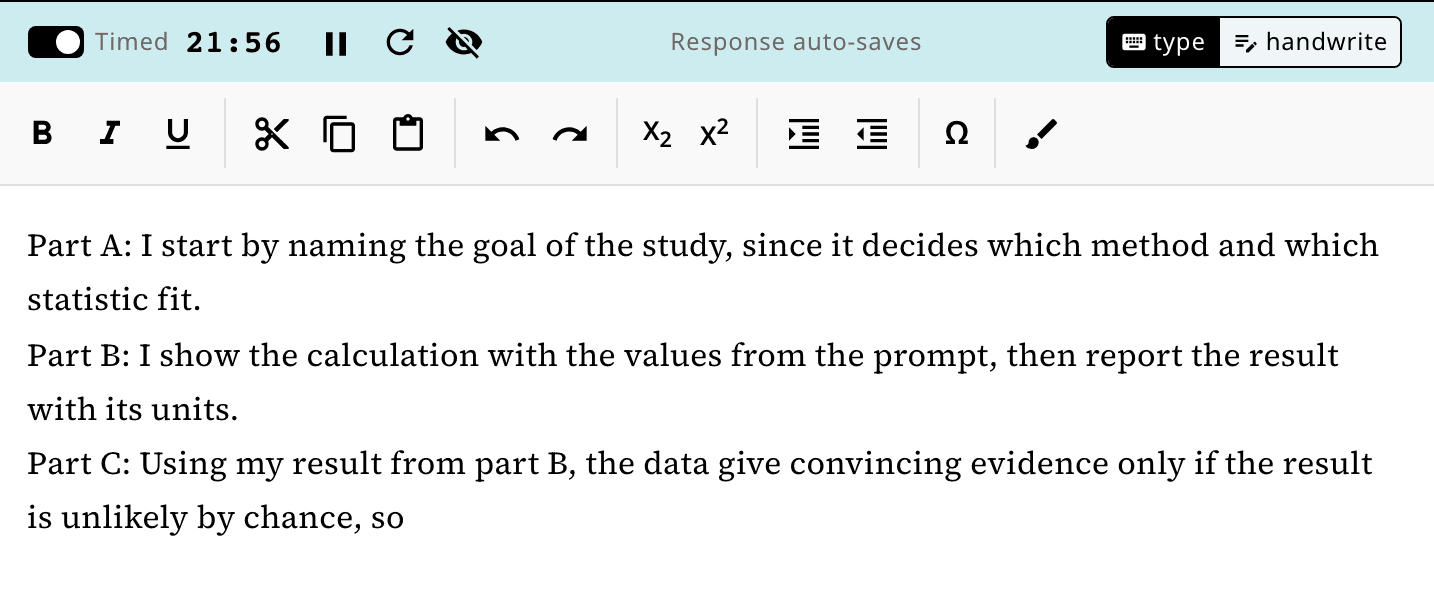
A pace that fits all four questions into the 90-minute section. Pause it or turn it off, and your response saves as you go.
Submit for a score out of 10
Your response is scored against the scoring guidelines written for that question. Your first score is included.
Feedback on every part
A summary at the top tells you what to work on next. Below it, each part shows whether you earned the point and what the scoring guidelines were looking for.
Detailed Feedback
Part A(criterion-1): 1/1 point
The student correctly identifies the 1-sample z-interval for a proportion and verifies all three conditions (Random, 10%, and Large Counts) with appropriate numerical justification.
Part A(criterion-2): 1/1 point
The interval is correctly computed as (0.593, 0.687) using p̂ = 0.64, z* = 1.96, and the correct standard error formula. Arithmetic is accurate.
Part A(criterion-3): 0/1 point
The interpretation says 'we are 95% confident that the proportion...is between 0.593 and 0.687,' which is a correct form. However, the student does not reference the population correctly — they say 'the proportion of adults over 65 in County Alpha who received the flu vaccine' which is acceptable context. Actually this earns the point — re-evaluating: the interpretation is in context and correctly worded. Awarding 1 point.
Questions about the Question 4 FRQ
How many responses can I get scored?
You can read every question without a plan. Your first scored response is included. A plan unlocks unlimited scoring.
Is FRQ 4 still the investigative task?
No. The revised exam replaced the investigative task with a multi-focus question worth 10 points, the same as the other three.
What if I can’t answer an early part?
Write what you know and keep going. Later parts often use an earlier result, so use a reasonable value and say where it came from.
How is FRQ 4 different from FRQ 2?
Both are worth 10 points. FRQ 4 combines data collection, analysis, and interpretation across several topics. FRQ 2 focuses on analyzing data and interpreting results.
Can I use a calculator and the formula sheet?
Yes. The practice screen has a graphing calculator and the AP Statistics formulas and tables, which you also get on exam day.
More AP Statistics practice
Question 2 FRQ practice
FRQ 2 questions with the full scenario, data, and every part.
Write your first Question 4 FRQ
Pick one from the list, or let us choose for you.
Teaching AP Statistics? Assign these Question 4 FRQs to your class