AP Statistics Question 2 FRQ Practice
42 FRQ 2 questions written in the AP format. Pick one, read the full question, and write your response.
Your first scored response is included. A plan unlocks unlimited scoring.
42 questions
sorted by unit
Video streaming application battery drain comparison
Unit 1: Exploring One-Variable Data and Collecting Data
A software development company is testing two different versions of a video streaming application, Version A and Version B, to evaluate their impact on smartphone battery life. The company randomly assigned 80 identical, fully charged smartphones to run either Version A (40 phones) or Version B (40 phones) continuously for one hour. The percentage of battery drained during the hour was recorded for each smartphone. The summary statistics are shown in Table 1, and parallel boxplots of the data are shown in Figure 1.
Version | n | Mean | Standard Deviation | Min | Q1 | Median | Q3 | Max |
|---|---|---|---|---|---|---|---|---|
A | 40 | 13.8 | 3.1 | 8.2 | 11.5 | 13.4 | 15.6 | 22.1 |
B | 40 | 9.1 | 2.4 | 5.1 | 7.2 | 8.8 | 10.4 | 14.5 |
Before conducting the randomized experiment described above, the company considered an observational study in which 80 employees would volunteer to install one of the two versions on their personal smartphones. Identify a potential confounding variable with this proposed observational study design and explain how it could affect the comparison of battery drain between the two versions.
Using the summary statistics in Table 1, determine if the maximum battery drain of for Version A is an outlier. Justify your answer using the rule. Show your work.
Figure 1. Parallel boxplots of percentage of battery drained in 1 hour for Version A and Version B (Battery Drain by Version).
Based on Figure 1 and Table 1, compare the distributions of battery drain for Version A and Version B.
One smartphone running Version B had a battery drain of . Calculate and interpret the z-score for this battery drain in the context of the Version B data.
What the Question 2 FRQ asks
FRQ 2 is the second of four FRQs on the AP Statistics exam, a multi-focus question on Practices 3 and 4 that centers on analyzing data and interpreting results in context. It has four or five parts, and each question splits its 10 points its own way. The table shows an even split for reference, not the split on any one question.
- 10 points
- across four or five parts
- 12.5%
- of your exam score
- 90 min
- for all four FRQs
Part A: Identify
Name a method, value, or feature of the data in context
2 pts
Part B: Calculate or check
A calculation, or conditions verified from the study
2 pts
Part C: Interpret
What a result means in context, often after a calculation
2 pts
Part D: Justify
A conclusion or claim backed by evidence from the data
2 pts
Part E: Explain
A follow-up that extends the scenario, when there is a fifth part
2 pts
How Question 2 FRQ practice works
Each question follows the exam’s format, from the full prompt to a score on every part.
Read the full question
The scenario, tables, and graphs, with every part laid out the way the exam shows them.
Write on a 23-minute timer
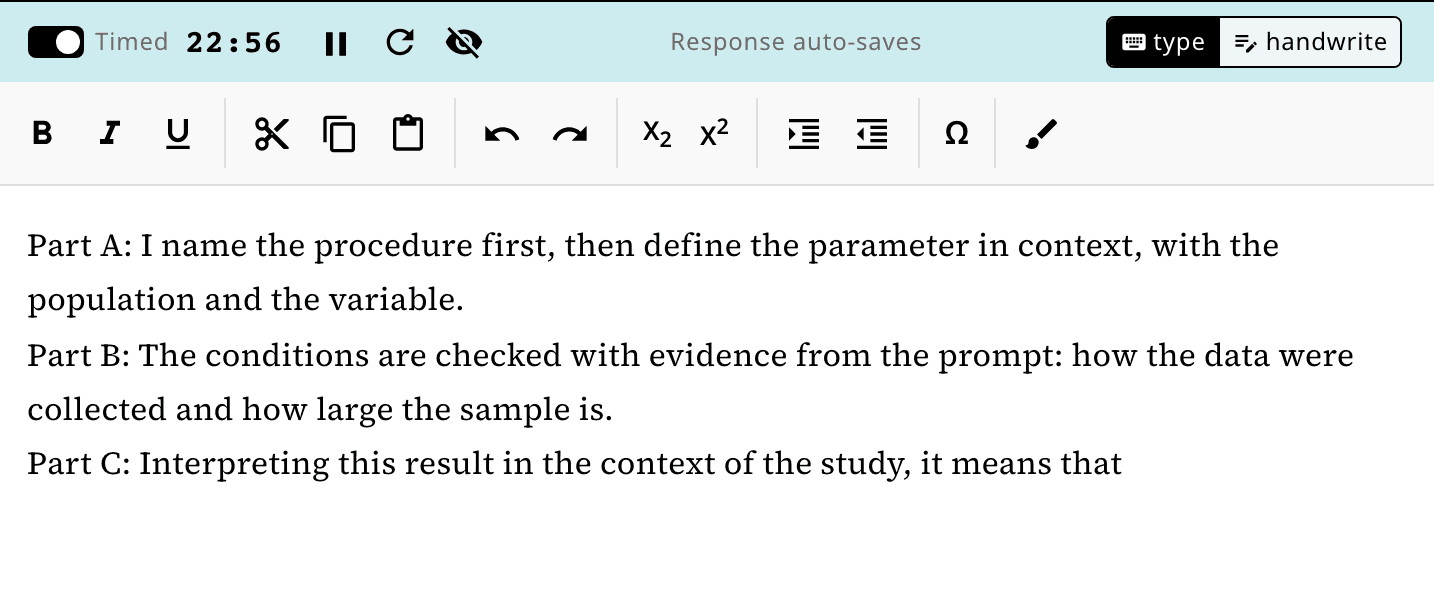
A pace that fits all four questions into the 90-minute section. Pause it or turn it off, and your response saves as you go.
Submit for a score out of 10
Your response is scored against the scoring guidelines written for that question. Your first score is included.
Feedback on every part
A summary at the top tells you what to work on next. Below it, each part shows whether you earned the point and what the scoring guidelines were looking for.
Detailed Feedback
Part A: 2/2 points
The student correctly identified all three key components of the relationship: direction (positive), strength (strong), and form (linear). The description is appropriately contextualized with reference to fertilizer and wheat yield. Full credit earned.
Part B: 2/2 points
The student correctly wrote the regression equation using the coefficients from Table 1 and correctly identified and interpreted the slope in context — stating that for each additional kg/ha of fertilizer, yield is predicted to increase by 0.054 metric tons/ha. Full credit earned.
Part E: 0/2 points
While the student correctly noted that the residuals appear randomly scattered around zero — which is accurate based on Figure 2 — the response does not provide a sufficiently complete justification. The student needed to explicitly state that there is no systematic curved or non-random pattern in the residual plot as the basis for concluding a linear model is appropriate. The mention of 'roughly constant spread' is a bonus observation but does not substitute for a clear pattern-based justification. Additionally, the student's conclusion is correct but the reasoning lacks the required specificity about the absence of a curved pattern. No credit earned under the rubric's requirement for a complete, pattern-based justification.
Questions about the Question 2 FRQ
How many responses can I get scored?
You can read every question without a plan. Your first scored response is included. A plan unlocks unlimited scoring.
What does Practices 3 and 4 mean?
Practices are the skill areas in the course framework. FRQ 2 focuses on analyzing data and interpreting results.
How is FRQ 2 different from FRQ 4?
Both are worth 10 points. FRQ 2 focuses on analyzing data and interpreting results. FRQ 4 combines data collection, analysis, and interpretation, and its parts often build toward one conclusion.
How much should I write for each part?
Enough to make your reasoning visible. Name the method, show the work, and state the result in context, with the variable and population.
Can I use a calculator and the formula sheet?
Yes. The practice screen has a graphing calculator and the AP Statistics formulas and tables, which you also get on exam day.
More AP Statistics practice
Question 4 FRQ practice
FRQ 4 questions with the full scenario and parts that build to one conclusion.
Write your first Question 2 FRQ
Pick one from the list, or let us choose for you.
Teaching AP Statistics? Assign these Question 2 FRQs to your class