AP Physics C: Mechanics Experimental Design FRQ Practice
37 Experimental Design and Analysis questions written in the AP format. Pick one, read the lab setup and data, and write your response.
Your first scored response is included. A plan unlocks unlimited scoring.
37 questions
sorted by unit
Constant acceleration motion with photogate measurements
Unit 1: Kinematics
A cart moves in the positive x-direction on a straight horizontal low-friction track. At the marked start line, x = 0, the cart has an unknown nonzero speed v_0. After crossing the start line, its controller maintains an unknown constant acceleration a. A narrow flag on the cart passes through one movable photogate, which measures the instantaneous speed v at the gate. Figure 1 defines x as the measured distance from the start line to the photogate sensing line. Analyze the motion kinematically; no force model is needed.
Figure 1. Movable-photogate setup and position reference.
Describe a procedure for collecting data that can determine both a and v_0 from a linear graph. State what is varied, what is measured, how x is referenced in Figure 1, and one way to reduce uncertainty.
Derive a linear relationship for the collected data. Identify the quantities on both axes and explain how the slope and intercept determine a and v_0.
Figure 2. Grid for student graph.
Synthetic idealized measurements for one constant-acceleration motion, rounded to three decimals.
Photogate position x (m) | Measured speed v (m/s) |
|---|---|
0.200 | 0.825 |
0.400 | 1.000 |
0.600 | 1.149 |
0.800 | 1.281 |
1.000 | 1.400 |
The measurements are shown in Table 1.
Indicate the quantities that should be graphed.
Vertical axis: Horizontal axis:
On the blank grid in Figure 2, create the graph using Table 1. Label both axes with units and plot all five calculated points.
Draw a single best-fit line for the plotted data.
Calculate experimental values for a and v_0. Use the slope and intercept of the best-fit line from part C.
What the Experimental Design FRQ asks
The Experimental Design and Analysis question is FRQ 3 on the AP Physics C: Mechanics exam. You plan a lab to find a quantity such as a spring constant or a moment of inertia, explain how to graph the data, then graph a data table and use a best-fit line to calculate the value.
- 25–30 min
- suggested on the exam
- 10 points
- across parts A to D
- 95 min
- for all four FRQs
Part A: Procedure
Describe how to collect data with the equipment provided
2 pts
Part B: Analysis plan
Describe what to graph and how the graph gives the quantity
2 pts
Part C: Graph
Choose two quantities, graph the data table, and draw a best-fit line
4 pts
Part D: Experimental value
Calculate the quantity from your best-fit line
2 pts
How Experimental Design FRQ practice works
Each question follows the exam’s format, from the full prompt to a score on every part.
Read the setup and data
The lab scenario, the equipment, the data table, and parts A through D, laid out the way the exam shows them.
Write on a 27-minute timer
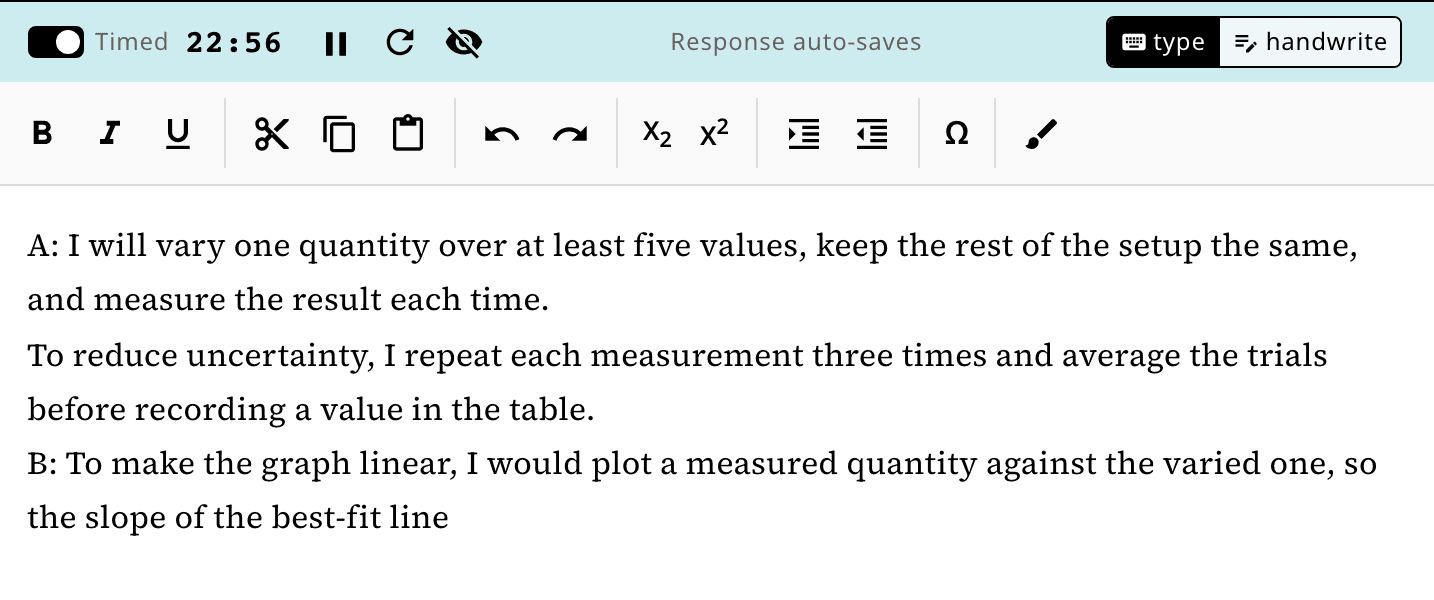
Inside the 25 to 30 minutes the exam suggests for this question. Pause it or turn it off, and your response saves as you go.
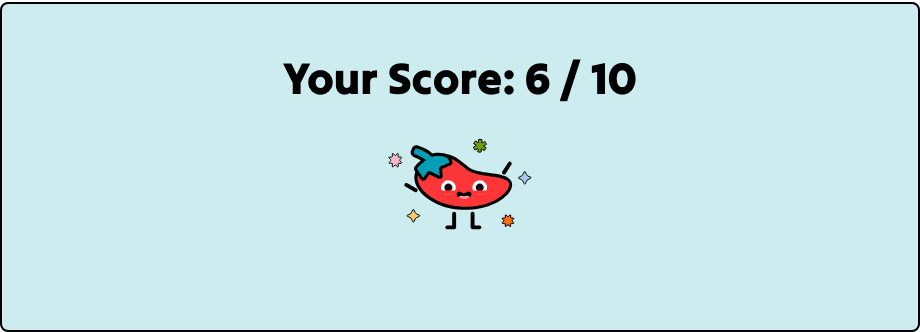
Submit for a score out of 10
Your response is scored against the scoring guidelines written for that question. Your first score is included.
Feedback on every part
A summary at the top tells you what to work on next. Below it, each part shows whether you earned the point and what the scoring guidelines were looking for.
Detailed Feedback
Part A: 1/1 point
Earned the point. You correctly described a procedure that includes measuring the compression distance d with a meterstick and the maximum velocity vmax with a motion sensor for multiple trials.
Part A: 1/1 point
Earned the point. You correctly identified repeating the trials for the same value of d and averaging the results as a valid method to reduce experimental uncertainty.
Part C: 0/1 point
Did not earn the point. You left this part blank. You needed to indicate which quantities from the table you would plot on the vertical and horizontal axes (e.g., vmax and d).
Questions about the Experimental Design FRQ
How many responses can I get scored?
You can read every question without a plan. Your first scored response is included. A plan unlocks unlimited scoring.
Do I need to have done the lab before?
No. The question describes the setup and the equipment you can use, and gives you a data table to graph in part C.
What should I plot?
Two quantities that give a straight line, so the slope or intercept leads to the value you need. Part C asks you to name them before you graph.
How do I make the graph?
Use the drawing tool to plot the data on the grid and draw a best-fit line. You can also graph on paper, switch to handwrite, and add a photo of your page.
Are these real College Board questions?
No. We wrote them in the AP format, with the same four parts, and wrote scoring guidelines for each one.
More AP Physics C: Mechanics practice
Mathematical Routines FRQ practice
Mathematical Routines questions with the full scenario, figures, and both parts.
Representations FRQ practice
Translation Between Representations questions with the full scenario and all four parts.
Qualitative/Quantitative FRQ practice
Qualitative/Quantitative Translation questions with the full scenario and all three parts.
AP Physics C: Mechanics FRQs
Every FRQ type for AP Physics C: Mechanics, with practice for each.
Write your first Experimental Design FRQ
Pick one from the list, or let us choose for you.
Teaching AP Physics C: Mechanics? Assign these Experimental Design FRQs to your class