AP Physics 2 Experimental Design FRQ Practice
68 Experimental Design and Analysis questions written in the AP format. Pick one, read the setup and data, and write your response.
Your first scored response is included. A plan unlocks unlimited scoring.
68 questions
sorted by unit
Gas pressure-temperature calibration relationship
Unit 9: Thermodynamics
In Experiment 1, a student is given a sealed cylinder containing a small amount of dry air and fitted with a frictionless, movable piston of cross-sectional area . The piston can move to change the volume of the trapped gas, and the student is asked to design an experiment to calibrate the gas as a thermometer and then use it to investigate thermal energy transfer when the gas is placed in thermal contact with objects at different temperatures.
Describe a procedure for collecting data that would allow the student to determine a calibration relationship between pressure and absolute temperature for the gas when the volume is held constant. In your description, include the measurements to be made. Include any steps necessary to reduce experimental uncertainty.
Describe how the collected data could be analyzed to determine the calibration relationship between and . Include references to appropriate equations and to relationships between measured and known quantities.
Figure 1. Constant-volume gas thermometer calibration apparatus (piston locked) and thermal-contact setup.
Figure 2. Graph grid for determining the proportionality constant in the constant-volume ideal-gas relationship.
T (°C) | P (kPa) |
|---|---|
0.0 | 86.1 |
20.0 | 92.0 |
40.0 | 97.9 |
60.0 | 103.8 |
80.0 | 109.7 |
T (K) | P (kPa) |
|---|
In Experiment 2, the student clamps the piston so the gas volume remains constant and places the cylinder in water baths at different temperatures. After waiting long enough for the gas to reach thermal equilibrium with the bath, the student records the bath temperature and the corresponding gas pressure . Table 1 contains the data collected.
Indicate two quantities, either measured quantities from Table 1 or additional calculated quantities, that could be graphed to produce a straight line that could be used to determine the proportionality constant in the constant-volume ideal-gas relationship.
Vertical axis: Horizontal axis:
On Figure 2, create a graph of the quantities indicated in part C(i) that can be used to determine the proportionality constant.
Use Table 2 to record the data points or calculated quantities that you will plot.
Clearly label the axes, including units as appropriate.
Plot the points you recorded in Table 2.
Draw a best-fit line for the data graphed in part C(ii).
Using the best-fit line that you drew in part C(iii), calculate the final temperature of the gas (and block). Then calculate the magnitude of the change in thermal energy of the metal block, , during the process. After completing the calibration, the student uses the clamped, constant-volume gas as a thermometer in a new trial. The cylinder is wrapped in the insulating sleeve and placed in thermal contact with a metal block of mass that is initially at . Before contact, the gas is at . The student observes that, after a long time, the gas pressure reaches a steady value of . The student assumes (i) the gas remains ideal and at constant volume, (ii) the block and gas reach the same final temperature, and (iii) energy exchange with the surroundings is negligible. The specific heat capacity of the metal block is .
What the Experimental Design FRQ asks
The Experimental Design and Analysis question is FRQ 3 on the AP Physics 2 exam. You design a procedure to answer a question about a physical system, then graph data from a similar experiment and use your best-fit line to find a physical quantity.
- 25–30 min
- suggested on the exam
- 10 points
- across parts A to D
- 95 min
- for all four FRQs
Part A: Procedure
How to collect the data: what you vary, what you measure, and with what
2 pts
Part B: Analysis plan
How you would graph the data and what the graph tells you
2 pts
Part C: Graph
Choose quantities that give a straight line, plot the data, and draw a best-fit line
4 pts
Part D: Calculation
A value calculated from your best-fit line
2 pts
How Experimental Design FRQ practice works
Each question follows the exam’s format, from the full prompt to a score on every part.
Read the setup and data
The lab scenario, the data table, and all four parts, A through D, laid out the way the exam shows them.
Write on a 27-minute timer
Inside the 25 to 30 minutes the exam suggests for this question. Pause it or turn it off, and your response saves as you go.
Submit for a score out of 10
Your response is scored against the scoring guidelines written for that question. Your first score is included.
Feedback on every part
A summary at the top tells you what to work on next. Below it, each part shows whether you earned the point and what the scoring guidelines were looking for.
Detailed Feedback
Part A: 0/1 point
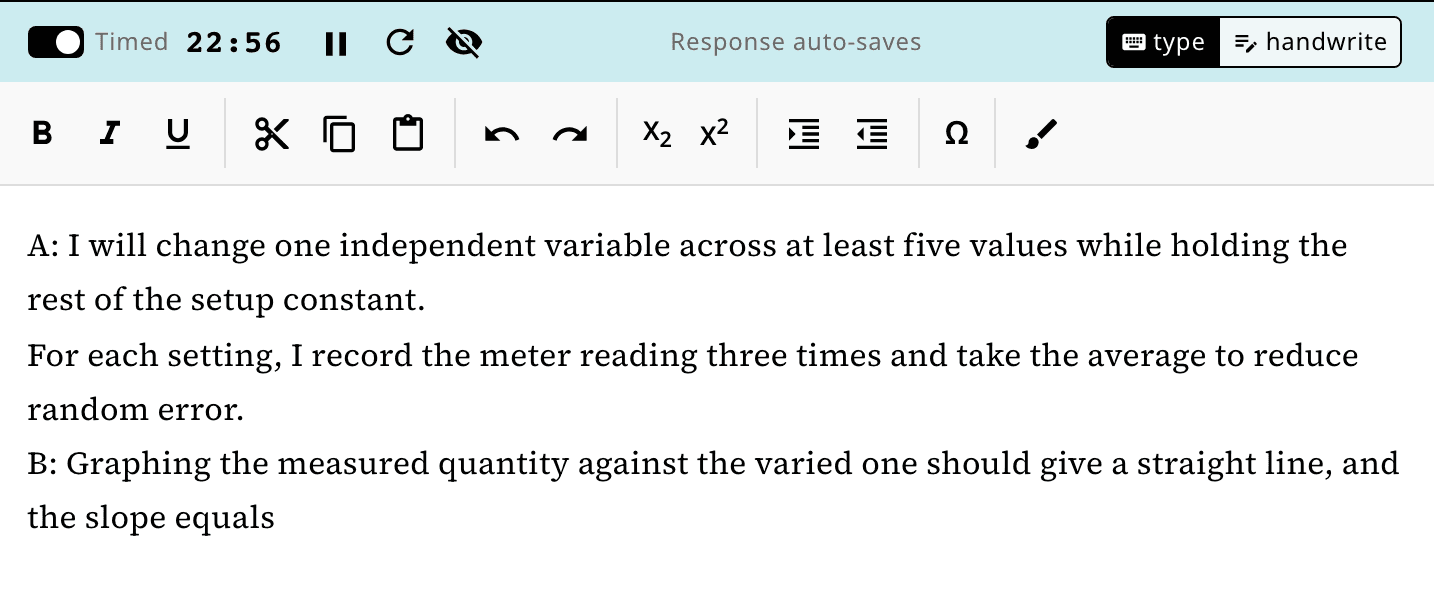
Did not earn the point. You mentioned measuring pressure and temperature, but you did not include a measurement for the height of the piston or the volume of the gas. Without measuring the volume (or height to calculate volume), you cannot determine the number of moles.
Part A: 1/1 point
Earned the point. You correctly identified taking multiple measurements and waiting for the system to reach thermal equilibrium as valid methods to reduce experimental uncertainty.
Part B: 1/1 point
Earned the point. You correctly indicated that the ideal gas law, PV = nRT, can be used to analyze the data.
Questions about the Experimental Design FRQ
How many responses can I get scored?
You can read every question without a plan. Your first scored response is included. A plan unlocks unlimited scoring.
How do I make the graph in part C?
Open the drawing tool in the editor and plot it there. You can also graph it on paper, switch to handwrite, and add a photo of your page.
What equipment can my procedure use?
Equipment a typical high school lab would have, like a ruler, a voltmeter, or an ammeter. Say what you vary, what you measure, and how you measure it.
Is the data in part C from my own procedure?
No. Part C gives you data from a similar experiment. Your analysis plan from part B still helps you choose what to graph.
Are these real College Board questions?
No. We wrote them in the AP format, with the same four parts, and wrote scoring guidelines for each one.
More AP Physics 2 practice
Mathematical Routines FRQ practice
Mathematical Routines questions with the full scenario, figures, and both parts.
Representations FRQ practice
Translation Between Representations questions with the full scenario and all four parts.
Qualitative/Quantitative FRQ practice
Qualitative/Quantitative Translation questions with the full scenario and all three parts.
Write your first Experimental Design FRQ
Pick one from the list, or let us choose for you.
Teaching AP Physics 2? Assign these Experimental Design FRQs to your class