AP Microeconomics Long FRQ Practice
101 long FRQs written in the AP format. Pick one, read the full question, and write your response.
Your first scored response is included. A plan unlocks unlimited scoring.
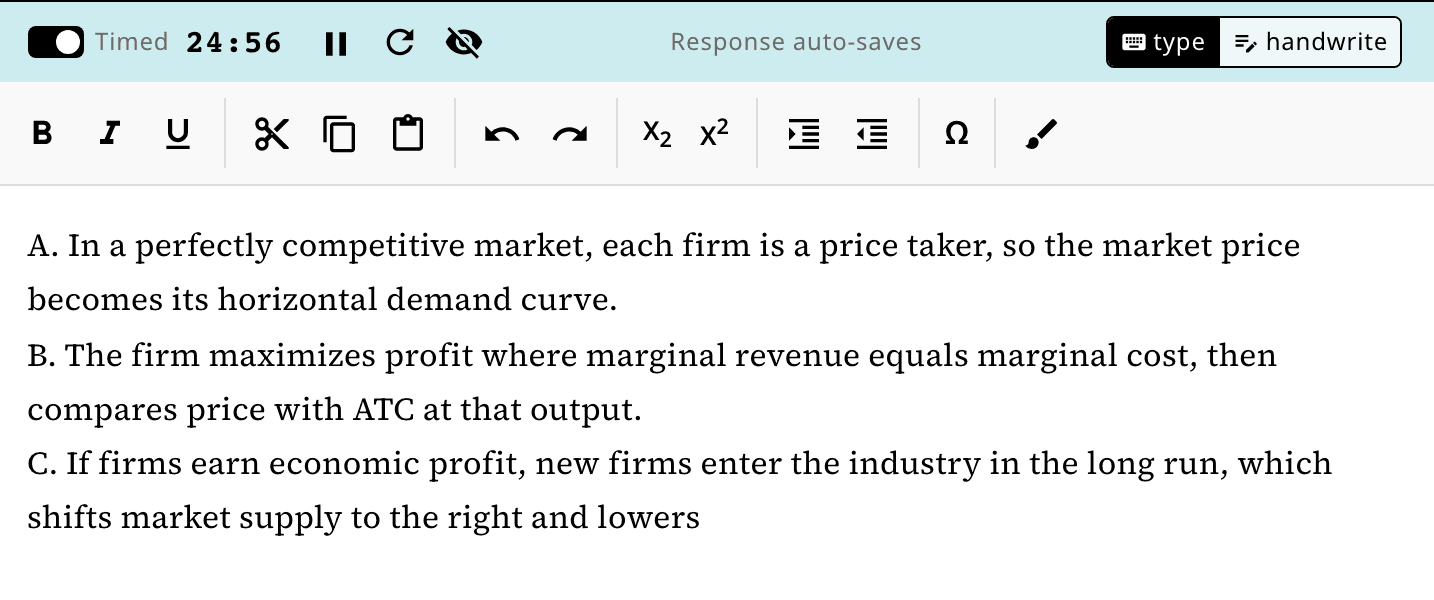
101 questions
sorted by unit
Production possibilities and opportunity cost analysis
Unit 1: Basic Economic Concepts
Assume that Country Alpha and Country Beta produce only two goods: wheat and cloth. Both countries have constant opportunity costs of production and trade with each other.
The table below shows the maximum amount of each good that can be produced in one day if all resources are fully employed.
Production Possibilities Data
Country | Maximum Wheat Production | Maximum Cloth Production |
|---|---|---|
Alpha | 100 | 50 |
Beta | 40 | 40 |
Draw a correctly labeled graph of the production possibilities curve for Country Alpha and show each of the following.
The vertical axis labeled Wheat and the horizontal axis labeled Cloth
A curve showing the numerical values of the maximum output of each good
A point representing an underutilization of resources, labeled U
A point representing full employment of resources, labeled F
Calculate the opportunity cost of producing one unit of cloth in Country Alpha. Show your work.
Use the data in the table to answer the following.
Which country has the comparative advantage in producing wheat? Explain.
Which country has the absolute advantage in producing cloth? Explain.
Assume that Country Alpha and Country Beta decide to trade.
Identify a specific number of units of wheat that could be traded for one unit of cloth that would be mutually beneficial to both countries.
If Country Alpha specializes according to its comparative advantage, will it import wheat or cloth? Explain.
Assume that a new technology is developed that improves the efficiency of producing wheat in Country Alpha, but not cloth. On your graph in part A, draw the new production possibilities curve for Country Alpha.
What the Long FRQ asks
The long FRQ is FRQ 1 on the AP Microeconomics exam. It sets up one market, changes something like a price control or a cost, and asks you to graph, calculate, and explain what follows, often into a related market.
- 25 min
- suggested writing time
- 10 points
- usually across parts A to E
- 50%
- of your FRQ section score
Part A: Graph
A correctly labeled graph, with the key curves and values marked
4 pts
Part B: Analysis
Explain or calculate one result from your graph
1 pt
Part C: A change
Show a change on the graph and explain its effect
2 pts
Part D: Effect
Identify or explain one outcome of the change
1 pt
Part E: Extension
A calculation with the work shown, or an effect in a related market
2 pts
How Long FRQ practice works
Each question follows the exam’s format, from the full prompt to a score on every part.
Read the full question
The scenario, any data or tables, and every part, laid out the way the exam shows them.
Write on a 25-minute timer
The time to plan for on exam day. Pause it or turn it off, and your response saves as you go.
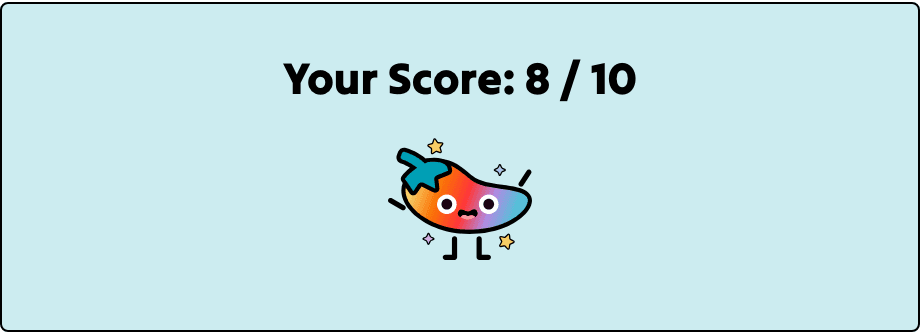
Submit for a score out of 10
Your response is scored against the scoring guidelines written for that question. Your first score is included.
Feedback on every part
A summary at the top tells you what to work on next. Below it, each part shows whether you earned the point and what the scoring guidelines were looking for.
Detailed Feedback
Part A(i): 1/1 point
Earned the point. Your graph correctly shows a linear downward-sloping PPC with Solar Panels on the horizontal axis and Electric Vehicles on the vertical axis. The numerical values of the intercepts are clearly labeled: 50 on the vertical axis and 100 on the horizontal axis.
Part A(ii): 1/1 point
Earned the point. You correctly plotted a point labeled 'I' inside (below) the production possibilities curve, representing an inefficient use of resources.
Part E(i): 0/1 point
Did not earn the point. While you stated that 'the curve will shift outwards,' you did not show this on your graph from part A as required. The question specifically asks you to show the effect on the graph itself. Additionally, you needed to demonstrate that only the vertical intercept shifts outward (since the new technology affects only Electric Vehicle production) while the horizontal intercept remains at 100, creating a pivoting effect rather than a parallel shift.
Questions about the Long FRQ
How many responses can I get scored?
You can read every question without a plan. Your first scored response is included. A plan unlocks unlimited scoring.
How do I draw graphs?
When a part asks for a graph, open the drawing tool and sketch it on a grid with axes. You can also switch the editor to handwrite, draw on paper, and add a photo of your page.
Is every long FRQ split the same way?
No. Most start with a 4-point graphing part, and the other points shift between parts from question to question. The table shows the most common split.
How is the long FRQ different from FRQs 2 and 3?
The long FRQ is worth 10 points and follows one market through several changes. FRQs 2 and 3 are worth 5 points each and focus on one model.
Can I use a calculator?
Yes. A four-function calculator is built into the writing screen, the same kind the exam allows.
More AP Microeconomics practice
Question 2 Short FRQ practice
Short FRQs for question 2, with the full scenario and every part.
Question 3 Short FRQ practice
Short FRQs for question 3, with the full scenario and every part.
AP Microeconomics FRQs
Every FRQ type for AP Microeconomics, with practice for each.
Write your first Long FRQ
Pick one from the list, or let us choose for you.
Teaching AP Microeconomics? Assign these Long FRQs to your class