Ah, numbers. You thought you could escape them by taking a social science class. But, here’s the thing, understanding numbers and what they mean is an integral part of understanding trends, patterns of behavior, and connecting them to political principles. The charts and graphs that researchers create help us make sense of the world.
These researchers turn random numbers into data sets, charts, or graphs. Your job is to figure out what they mean by interpreting those visual representations of data. Here’s how to go about it:
Timing
🚨NOTE FOR 2019-2020 TESTERS: The APGOPO test will consist of the Argument Essay (25 Minutes + 5 to upload) and Concept Application (15 minutes + 5 to upload). The APCompGov test will consist of the Argument Essay (25 Minutes + 5 to upload) and Quantitative Analysis (15 minutes + 5 to upload).
Back to regularly scheduled programming: If you’re in APGOPO, you have an hour and 40 minutes to finish the FRQ section. APCompGov kiddos, you have an hour and 30. It’s important to use your time effectively because the FRQ section is worth half of your score.
Because of that, you should spend around 20 minutes (maybe a bit less or more) on the second Free-Response Question.


Structure (What You’ll Be Asked to Do)
If you thought that you were going to be presented with a chart, or graph, or some kind of wonky visual of data, then congrats. You were right! If not, don’t worry. The point of this article is to tell you what to expect and how to navigate this FRQ, anyways.
You’re going to be given some kind of visual. Like I said, it could be some kind of chart or graph, but either way, you’re going to have to do the exact same thing: break down what it means. Don’t worry about the data being something completely out of left field because it won’t be. It’s going to be from a real poll or research study that was conducted. That’s pretty cool, right?

There’s four (GoPo) or five (CompGov) parts to the Quantitative Analysis FRQ.
In these parts, you could be asked to do a few different things, including but not limited to identifying what group or people or country has a certain characteristic, explaining what the data reveals about a certain group, how an institution could use the data act while solving a problem. Pay attention to the patterns the data illustrates and how they connect to what you learned in class!
To sum it up, you’ll be asked to describe and analyze data in a few different ways and apply the data to how a politician/country/institution could use the data to navigate a situation.
Now that you know what to expect, let’s figure out how to actually tackle the quantitative analysis FRQ!
An Effective Approach 🧐
Here’s what you need to do to tackle this FRQ in an effective way:
Skim the questions first! Looking at the chart and figuring out what trends and/or patterns you can find is a waste of time. By looking at the questions first, you know exactly what to look for and can easily go reference the chart to find it.
Ignore the irrelevant stuff 🙈. When you’re looking at a chart or graph, there may be a country/group that none of the prompts ask you about. That’s okay! You’re not going to need to include all of the information from the chart every time. Just use what you need to answer the prompt!
Tie it back to course concepts! The data is there for you to interpret, but when you’re asked to explain something, you need to write why the data looks the way it does. Make sure to note what countries, political systems, or the racial or gender the data references because they’ll probably guide you towards how you should answer the prompts.
Answer the prompt fully. This is critical to ensuring you get full points. So, if the prompt asks you to identify the group that would most likely support the Free Ice Cream Amendment based on a chart that says 72% of Borples support it, 28% of Storgles support it, and 1% of Bluples support it. Make your answer explicit: the Borples would be most likely to support it because the poll shows that the overwhelming majority of them said they do!

Practice Prompts!
Here are some prompts to get you started on practicing:
AP GOPO
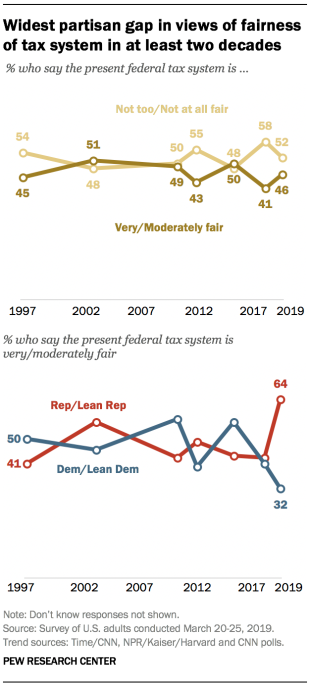
- Identify the political affiliation of people who are least likely to believe that the American taxation system is fair.
- Describe the difference between Democrats and Republicans on their attitudes towards fair taxation, based on the data in the graph.
- Explain how the data in the graph could influence how a Democratic candidate for US House that is running in an area heavily populated by Republicans.
- Explain how the data in the graph could influence taxation policy interactions between a majority Democrat House and Senate and a Republican President.
AP CompGov
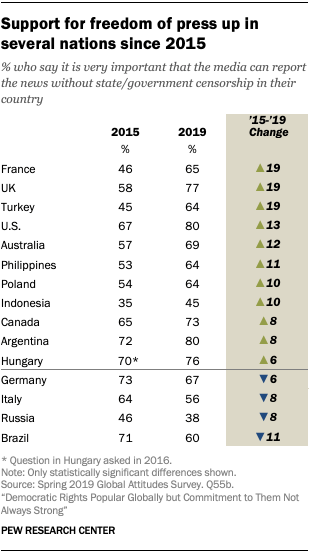
- Using the data, identify the country with the largest decrease in support for freedom of the press.
- Using the data, explain the trend of the United Kingdom’s support for freedom of the press from 2015 to 2019.
- Explain how the differences between democratic and authoritarian states’ approaches to influence and control of the media.
- Using your knowledge of the differences in democratic and authoritarian states’ degree of press freedoms, explain the pattern of Russian support for freedom of the press from 2015 to 2019. Watch: FRQ Practice and Q&A