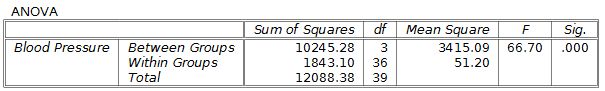
One-way ANOVA compares means across multiple groups, extending the t-test's capabilities. It analyzes between-group and within-group variability to determine if differences among groups are statistically significant. This powerful tool helps researchers understand the impact of categorical variables on continuous outcomes.
ANOVA uses the F-statistic, which compares between-group and within-group variability. By calculating sums of squares, mean squares, and degrees of freedom, researchers can assess if observed differences are due to chance or represent real effects. Post-hoc tests like Tukey's HSD pinpoint specific group differences.
ANOVA Basics
Overview of Analysis of Variance (ANOVA)
- Analysis of Variance (ANOVA) is a statistical method used to compare means across multiple groups or conditions
- Determines if there are significant differences between the means of three or more independent groups
- Extends the independent samples t-test, which can only compare means between two groups, to allow for comparisons among multiple groups
- Commonly used in experimental research designs to analyze the effect of categorical independent variables on a continuous dependent variable
Components of Variability
- Between-group variability measures the differences between the group means and the grand mean (mean of all observations)
- Reflects the effect of the independent variable on the dependent variable
- Larger between-group variability suggests that the independent variable has a significant effect on the dependent variable
- Within-group variability measures the differences between individual scores and their respective group means
- Represents the random variability or individual differences within each group
- Smaller within-group variability indicates that the groups are more homogeneous and the independent variable has a stronger effect
F-Statistic and Degrees of Freedom
- F-statistic is the ratio of the between-group variability to the within-group variability
- Calculated as:
- Larger F-values suggest that the between-group variability is greater than the within-group variability, indicating a significant effect of the independent variable
- Degrees of freedom (df) represent the number of independent pieces of information used to calculate the statistic
- Between-group df = number of groups - 1
- Within-group df = total number of observations - number of groups
- Total df = total number of observations - 1
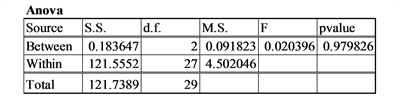
ANOVA Calculations
Sum of Squares and Mean Square
- Sum of squares (SS) measures the total variability in the data
- Total SS = , where is each individual score and is the grand mean
- Between-group SS = , where is the sample size of group , is the mean of group , and is the grand mean
- Within-group SS = Total SS - Between-group SS
- Mean square (MS) is the sum of squares divided by the respective degrees of freedom
- Between-group MS = Between-group SS / Between-group df
- Within-group MS = Within-group SS / Within-group df
Effect Size and Eta-Squared
- Effect size measures the magnitude of the difference between groups
- Indicates the practical significance of the results, beyond just statistical significance
- Eta-squared () is a common effect size measure for ANOVA
- Calculated as:
- Ranges from 0 to 1, with larger values indicating a stronger effect
- Interpretation guidelines: small effect (0.01), medium effect (0.06), and large effect (0.14)
Hypothesis Testing
Null and Alternative Hypotheses
- Null hypothesis () states that there is no significant difference between the group means
- Example: , where , , and are the population means for groups 1, 2, and 3, respectively
- Alternative hypothesis ( or ) states that at least one group mean is significantly different from the others
- Example: , where represents the group index
Post-hoc Tests and Tukey's HSD
- Post-hoc tests are conducted after a significant ANOVA result to determine which specific group means differ from each other
- Necessary because ANOVA only indicates that there is a significant difference, but does not specify which groups differ
- Tukey's Honestly Significant Difference (HSD) test is a commonly used post-hoc test
- Compares all possible pairs of group means while controlling for the familywise error rate
- Calculates the HSD statistic: , where is the studentized range statistic, and is the sample size per group
- If the absolute difference between two group means is greater than the HSD, the means are considered significantly different