Definition of income inequality
Income inequality describes the uneven distribution of economic resources among individuals or groups in a society. It serves as one of the most direct indicators of social stratification, because it reflects not just who earns what, but who gets access to opportunities like quality housing, healthcare, and education.
Several tools exist to quantify these disparities, and understanding them is essential for interpreting data you'll encounter throughout this unit.
Gini coefficient
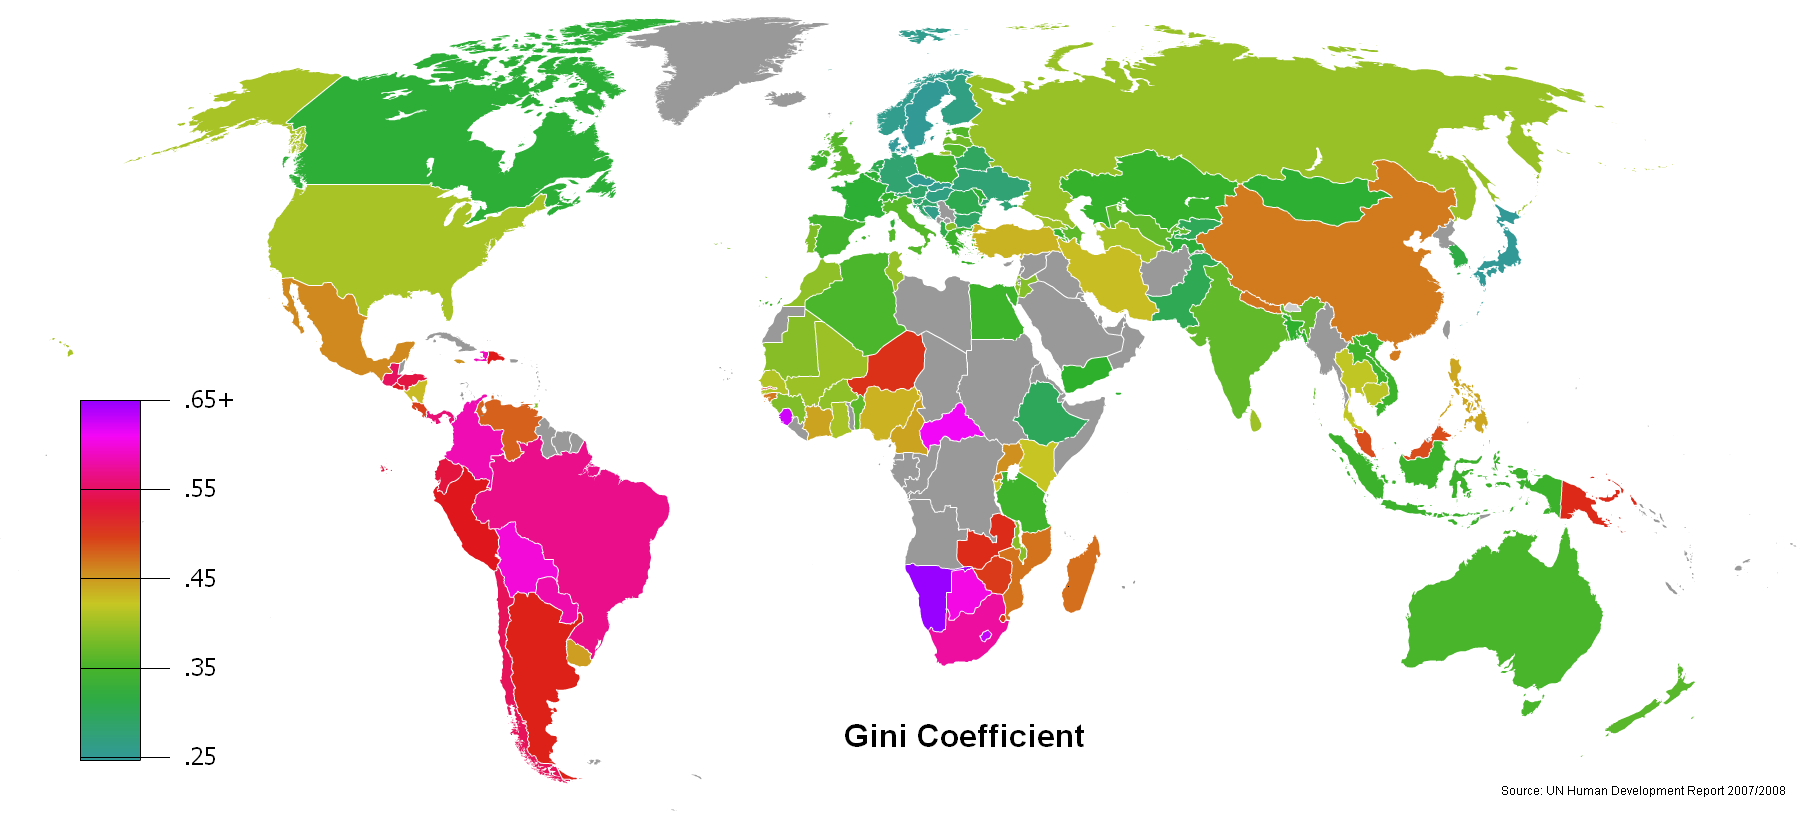
The Gini coefficient is a single number that summarizes how equally (or unequally) income is distributed across a population. It ranges from 0 (everyone earns exactly the same) to 1 (one person earns everything).
It's calculated using the Lorenz curve, which plots cumulative share of income (y-axis) against cumulative share of population (x-axis). A perfectly equal society would produce a straight 45-degree line. The Gini coefficient measures how far the actual curve bows away from that line.
- The U.S. Gini coefficient was roughly 0.49 in recent years, while Scandinavian countries like Sweden sit closer to 0.28.
- Higher Gini = greater inequality. This makes it useful for comparing countries or tracking a single country over time.
One limitation: two countries can have the same Gini coefficient but very different patterns of inequality (e.g., one with a squeezed middle class, another with extreme poverty at the bottom).
Income quintiles
Income quintiles divide the population into five equal groups (each 20%) ranked from lowest to highest income. You then compare what share of total national income each group receives.
- In a perfectly equal society, each quintile would receive 20% of total income.
- In the U.S., the top quintile receives roughly 50% of all income, while the bottom quintile receives around 3%.
This approach is especially good at highlighting the gap between top and bottom earners, making it more intuitive than a single number like the Gini coefficient.
Wealth vs. income
These two terms get confused constantly, but the distinction matters:
- Income is a flow: money received over a period of time (wages, salaries, investment returns, government transfers).
- Wealth is a stock: the total value of everything you own (home, savings, investments) minus everything you owe (debts, mortgages) at a single point in time.
Wealth inequality is almost always more extreme than income inequality. That's because wealth accumulates over time through savings, investment gains, and inheritance. A family that has owned property for three generations holds advantages that don't show up in annual income data alone. This intergenerational transfer of assets is a major driver of persistent stratification.
Historical trends
Income inequality hasn't followed a straight line through history. It has expanded and contracted in response to economic shifts, political decisions, and social movements. Tracking these patterns helps explain why inequality looks the way it does today.
Pre-industrial societies
Pre-industrial societies were marked by rigid social hierarchies where land ownership and aristocratic privilege concentrated wealth among a tiny elite. Most people worked in subsistence agriculture and lived at or near poverty.
Social mobility was extremely limited. Your economic position was largely determined at birth by your family's status, and formal systems like feudalism and caste structures reinforced those boundaries.
Industrial Revolution impact
The Industrial Revolution (roughly 1760s–1840s and beyond) reshaped income distribution in several ways:
- New wealth flowed to industrialists and entrepreneurs, creating fortunes that rivaled the old aristocracy.
- A middle class emerged for the first time at scale, as managers, professionals, and skilled tradespeople found new economic roles.
- Urban-rural income gaps widened as cities became centers of economic growth.
However, inequality initially increased during industrialization. Factory owners accumulated capital while workers faced low wages, long hours, and dangerous conditions. The benefits of economic growth were distributed very unevenly.

Post-World War II trends
The decades from roughly 1950 to 1975 are sometimes called the Great Compression because income inequality narrowed significantly in many developed countries. Several factors drove this:
- Progressive taxation (top U.S. marginal tax rates exceeded 90% in the 1950s)
- Expansion of social welfare programs (Social Security, unemployment insurance)
- Strong labor unions that negotiated higher wages and benefits for workers
Starting in the 1980s, inequality began rising again in the U.S. and many other developed nations. This reversal is linked to:
- Tax policy shifts (the top U.S. marginal rate dropped from 70% to 28% between 1980 and 1988)
- Technological change that rewarded highly skilled workers while displacing others
- Globalization and the outsourcing of manufacturing jobs to lower-wage countries
Causes of income inequality
No single factor explains income inequality. Multiple causes interact and reinforce each other, creating feedback loops that can be difficult to untangle.
Education and skills gap
Education is one of the strongest predictors of lifetime earnings. Workers with a bachelor's degree earn roughly 65% more than those with only a high school diploma over their careers.
- Skill-biased technological change means the economy increasingly rewards workers with advanced technical and analytical skills.
- Unequal access to quality education, starting as early as preschool, creates divergent economic trajectories before people even enter the workforce.
- Educational advantages tend to pass from parent to child. Wealthier families can afford better schools, tutoring, and enrichment activities, perpetuating inequality across generations.
Technological change
Automation and digitalization have eliminated many routine and low-skilled jobs (manufacturing, data entry, retail checkout) while increasing demand for workers in technology-intensive fields.
This contributes to wage polarization: high-skilled workers see rising wages while low-skilled workers face stagnant or declining pay. In some industries like software and entertainment, technology creates "winner-take-all" dynamics where a small number of top performers capture enormous rewards.
The pace of technological change also matters. When industries transform quickly, workers in displaced roles may not have time or resources to retrain.
Globalization effects
Globalization connects national economies through trade, investment, and labor flows. Its effects on inequality are uneven:
- Offshoring of manufacturing to low-wage countries (e.g., moving textile production to Bangladesh) reduces demand for domestic low-skilled labor.
- Global labor market competition puts downward pressure on wages for jobs that can be done anywhere.
- Highly skilled professionals who can operate in global markets tend to benefit, widening the gap between them and workers in locally bound occupations.
Trade agreements shape who wins and who loses. The gains from globalization are real, but they haven't been distributed equally within countries.
Tax policies
Tax policy is one of the most direct tools governments have for shaping income distribution.
- Progressive taxation reduces inequality by taxing higher incomes at higher rates and funding public services that benefit lower-income groups.
- Since the 1980s, many countries have lowered top marginal tax rates, which has contributed to rising post-tax inequality.
- Capital gains (profits from selling investments) are often taxed at lower rates than wages. Since wealthier individuals hold more investments, this disproportionately benefits them.
- Tax loopholes and offshore tax havens allow some high-income earners to reduce their effective tax rates well below the statutory rate.
The debate over tax policy centers on a tension: how to balance redistribution with incentives for economic growth and investment.
Measurement methods
How you measure inequality affects what you find. Different approaches capture different dimensions of economic disparity, and each has trade-offs.
Income vs. consumption
- Income-based measures track monetary inflows: wages, investment returns, government transfers.
- Consumption-based measures look at what people actually spend, which may better reflect day-to-day living standards.
Consumption inequality tends to be lower than income inequality because high earners save a larger share of their income. Some economists argue consumption is a better indicator of well-being, since it captures what people can actually afford. The challenge is that consumption data is harder to collect, especially in informal economies.
Household vs. individual
- Household measures treat the family or household as the unit of analysis, accounting for shared expenses (two people splitting rent spend less per person than two people living alone).
- Individual measures reveal disparities that household data can mask, such as the gender pay gap within households.
Researchers use equivalence scales to adjust household income for size and composition (a family of four needs more than a single person, but not four times as much). The choice between household and individual measurement depends on what question you're trying to answer.
Pre-tax vs. post-tax income
- Pre-tax (market) income shows what people earn before any government intervention.
- Post-tax income reflects what people actually have to spend after taxes are paid and government transfers (like food assistance or tax credits) are received.
Comparing the two reveals how much work fiscal policy is doing to reduce inequality. In countries with strong redistribution systems, the gap between pre-tax and post-tax inequality is large. Post-tax measures give a more accurate picture of disposable income, though they can be complicated by non-cash benefits (like public healthcare) and indirect taxes (like sales tax).
Global income inequality
Income inequality isn't just a within-country phenomenon. Massive disparities exist between nations, shaped by centuries of historical development, colonial legacies, and the structure of the global economy.
Developed vs. developing countries
Significant income gaps persist between high-income nations (U.S., Germany, Japan) and low-income nations (many in Sub-Saharan Africa and South Asia). Developed countries generally have higher average incomes and lower poverty rates, but developing countries often experience higher internal inequality, with a small wealthy elite alongside widespread poverty.
Economic growth in countries like China and India has pulled hundreds of millions out of extreme poverty, narrowing some global gaps. However, comparing living standards across countries is tricky because price levels differ dramatically (a dollar buys much more in rural India than in New York).
North-South divide
The North-South divide is a broad framework describing economic disparities between the industrialized "Global North" (North America, Europe, East Asia) and the developing "Global South" (much of Africa, Latin America, South and Southeast Asia).
This divide is rooted in colonial history and unequal patterns of development. It encompasses differences in:
- Technological capabilities and infrastructure
- Access to global markets and capital
- Political influence in international institutions (World Bank, IMF, WTO)
The concept is evolving as some Southern countries experience rapid growth, but persistent gaps in healthcare, education, and infrastructure remain.
BRICS nations
BRICS refers to Brazil, Russia, India, China, and South Africa, five large emerging economies that have reshaped global income distribution patterns through rapid growth.
- China's GDP growth averaged roughly 9-10% annually for three decades, lifting hundreds of millions out of poverty.
- Despite national-level growth, internal inequality remains high in most BRICS countries. India's Gini coefficient, for example, has been rising even as overall GDP grows.
- These nations have pushed for greater influence in global governance, including establishing the New Development Bank as an alternative to Western-dominated financial institutions.
The central challenge for BRICS nations is translating aggregate economic growth into broad-based improvements in living standards across all income groups.