Risk mapping is a crucial tool in risk management, helping organizations visualize and analyze potential threats. It integrates various techniques to create a comprehensive view of the risk landscape, enabling informed decision-making and resource allocation.
The process involves identifying risks, assessing their likelihood and impact, and prioritizing them based on significance. Visual tools like heat maps and matrices effectively display risk information, supporting strategic planning and risk mitigation efforts.
Definition of risk mapping
- Risk mapping visualizes and analyzes potential threats to an organization, helping risk managers identify, assess, and prioritize risks
- Integrates various risk management techniques to create a comprehensive view of an organization's risk landscape
- Serves as a crucial tool in the broader risk management and insurance framework, enabling more informed decision-making and resource allocation
Purpose and objectives
- Provides a clear visual representation of risks facing an organization
- Facilitates identification of high-priority risks requiring immediate attention
- Enables better understanding of risk relationships and potential cascading effects
- Supports strategic decision-making by aligning risk management with business objectives
Key components
- Risk identification process identifies potential threats and vulnerabilities
- Risk assessment evaluates the likelihood and potential impact of identified risks
- Risk prioritization ranks risks based on their significance to the organization
- Visual representation tools (heat maps, matrices) display risk information effectively
- Risk response strategies outline actions to mitigate, transfer, or accept identified risks
Risk identification process
- Forms the foundation of effective risk mapping by uncovering potential threats to an organization
- Involves systematic analysis of internal and external factors that could impact business objectives
- Requires collaboration across departments to ensure comprehensive risk coverage
Risk sources and categories
- Internal risks originate within the organization (operational, financial, strategic)
- External risks stem from outside factors (economic, political, environmental)
- Strategic risks relate to high-level business decisions and objectives
- Operational risks involve day-to-day business processes and systems
- Financial risks encompass market volatility, credit issues, and liquidity concerns
- Compliance risks arise from regulatory and legal requirements
Data collection methods
- Surveys and questionnaires gather input from employees across different levels
- Interviews with key stakeholders provide in-depth insights into specific risk areas
- Historical data analysis examines past incidents and trends
- Industry benchmarking compares organization's risk profile to peers
- Risk workshops facilitate collaborative risk identification sessions
Stakeholder involvement
- Senior management provides strategic direction and risk appetite guidance
- Department heads contribute domain-specific knowledge and risk insights
- Front-line employees offer practical perspectives on operational risks
- External experts (consultants, auditors) bring industry-wide risk knowledge
- Customers and suppliers provide valuable input on external risk factors
Risk assessment techniques
- Evaluate identified risks to determine their potential impact and likelihood of occurrence
- Provide a structured approach to quantifying and qualifying risks for informed decision-making
- Support the prioritization process by offering data-driven insights into risk severity
Qualitative vs quantitative methods
- Qualitative methods use descriptive scales to assess risks (high, medium, low)
- Advantages include simplicity and applicability to intangible risks
- Limitations include potential subjectivity and lack of precise measurements
- Quantitative methods employ numerical data and statistical analysis
- Advantages include precise measurements and ability to perform cost-benefit analysis
- Limitations include data requirements and potential complexity
Probability and impact analysis
- Probability assessment estimates the likelihood of a risk occurring
- Uses historical data, expert judgment, and statistical models
- Often expressed as a percentage or frequency (once in 10 years)
- Impact analysis evaluates the potential consequences of a risk event
- Considers financial, operational, and reputational impacts
- May use specific metrics (financial loss, downtime, market share loss)
- Combined probability and impact scores determine overall risk severity
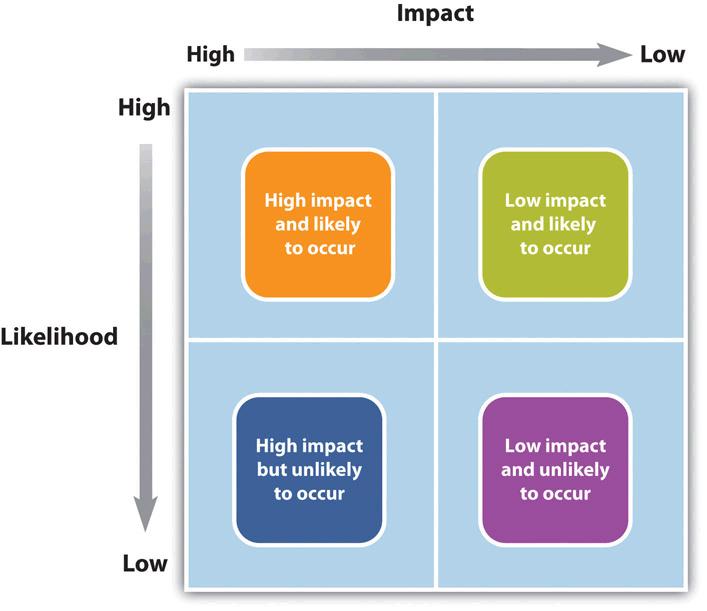
Risk matrices
- Visual tools that plot risks based on their probability and impact scores
- Typically use a 3x3, 5x5, or 7x7 grid format
- Color-coding helps quickly identify high (red), medium (yellow), and low (green) risks
- Facilitate comparison and prioritization of multiple risks
- Limitations include oversimplification and potential clustering of risks in the middle
Risk prioritization strategies
- Enable organizations to focus resources on the most critical risks
- Align risk management efforts with overall business objectives and risk appetite
- Support efficient allocation of time, budget, and personnel in risk mitigation efforts
Risk appetite and tolerance
- Risk appetite defines the level and types of risks an organization is willing to take
- Influenced by industry, regulatory environment, and strategic goals
- Often expressed in qualitative statements or quantitative metrics
- Risk tolerance specifies acceptable variation from risk appetite
- May vary across different risk categories or business units
- Helps set thresholds for risk prioritization and response
Prioritization criteria
- Severity combines probability and impact scores to rank risks
- Strategic alignment assesses how risks relate to core business objectives
- Control effectiveness evaluates the strength of existing risk mitigation measures
- Velocity considers how quickly a risk can impact the organization
- Interdependencies examine how risks may influence or trigger other risks
Ranking and scoring methods
- Weighted scoring assigns different importance to various risk factors
- Pareto analysis (80/20 rule) focuses on the vital few risks causing the most significant impact
- Multi-criteria decision analysis (MCDA) incorporates multiple factors in risk prioritization
- Analytic Hierarchy Process (AHP) uses pairwise comparisons to rank risks
- Monte Carlo simulation provides probabilistic risk rankings based on multiple scenarios
Risk mapping tools
- Provide visual representations of an organization's risk landscape
- Facilitate communication of complex risk information to stakeholders
- Support decision-making by highlighting key risk areas and relationships
Heat maps
- Two-dimensional matrices displaying risks based on probability and impact
- Color gradients (green to red) indicate increasing risk severity
- Allow for quick identification of high-priority risks
- Can be customized to include additional dimensions (bubble size, color shades)
- Limitations include potential oversimplification of complex risk relationships
Bow-tie diagrams
- Visualize the path from risk causes to consequences
- Central "knot" represents the risk event
- Left side shows potential causes and preventive controls
- Right side displays potential consequences and mitigating controls
- Useful for understanding risk drivers and identifying control gaps
Fault tree analysis
- Top-down approach to analyzing system failures or undesired events
- Uses Boolean logic to show relationships between various fault events
- Helps identify root causes and critical failure paths
- Supports quantitative analysis of failure probabilities
- Particularly useful for complex systems and processes
Integration with risk management
- Ensures risk mapping efforts translate into actionable risk management strategies
- Aligns risk mapping outcomes with overall enterprise risk management (ERM) framework
- Supports continuous improvement in an organization's risk management capabilities
Risk response planning
- Develops strategies to address prioritized risks identified through mapping
- Options include risk avoidance, reduction, transfer, and acceptance
- Considers cost-benefit analysis of different response options
- Assigns responsibility for implementing and monitoring risk responses
- Aligns responses with organization's risk appetite and strategic objectives
Resource allocation
- Directs financial and human resources towards highest priority risks
- Considers cost-effectiveness of risk mitigation measures
- Balances proactive risk management with reactive contingency planning
- Integrates risk management budgeting into overall financial planning process
- Ensures adequate resources for risk monitoring and control activities
Continuous monitoring
- Establishes key risk indicators (KRIs) to track risk levels over time
- Implements regular reporting mechanisms to update risk maps and assessments
- Utilizes technology solutions for real-time risk monitoring and alerts
- Conducts periodic reviews of risk mapping process and outcomes
- Adapts risk management strategies based on changing internal and external factors
Benefits of risk mapping
- Enhances an organization's ability to proactively manage and mitigate risks
- Supports the development of a robust risk management culture
- Contributes to improved organizational resilience and sustainability
Improved decision-making
- Provides clear, visual representation of risk landscape for informed choices
- Enables prioritization of risk management efforts and resource allocation
- Supports scenario analysis and contingency planning for potential risk events
- Facilitates cost-benefit analysis of risk mitigation strategies
- Enhances strategic planning by incorporating risk considerations
Enhanced risk communication
- Simplifies complex risk information for diverse stakeholders
- Facilitates discussions about risk priorities across different organizational levels
- Supports consistent risk reporting to board members and executives
- Improves transparency in risk management processes and decision-making
- Enhances stakeholder confidence in organization's risk management capabilities
Strategic alignment
- Ensures risk management efforts support overall business objectives
- Identifies potential risks and opportunities related to strategic initiatives
- Supports integration of risk considerations into strategic planning process
- Enhances organization's ability to balance risk and reward in decision-making
- Facilitates development of risk-aware corporate culture

Challenges in risk mapping
- Present obstacles that organizations must overcome to implement effective risk mapping
- Require ongoing attention and improvement in risk management practices
- Highlight areas where technology and expertise can enhance risk mapping capabilities
Data quality and availability
- Incomplete or inaccurate data can lead to flawed risk assessments
- Historical data may not accurately predict future risks in rapidly changing environments
- Difficulty in quantifying certain types of risks (reputational, strategic)
- Challenges in aggregating data from diverse sources and systems
- Privacy and security concerns in collecting and storing sensitive risk data
Subjectivity in assessments
- Varying risk perceptions among different stakeholders can lead to inconsistent evaluations
- Cognitive biases (optimism bias, anchoring) can influence risk assessments
- Difficulty in standardizing qualitative risk assessments across an organization
- Challenges in calibrating risk scales and ensuring consistent interpretation
- Potential for political or personal agendas to influence risk prioritization
Dynamic nature of risks
- Rapidly changing business environments require frequent updates to risk maps
- Emerging risks may not be captured by traditional risk identification methods
- Interconnected risks can create complex, cascading effects difficult to map
- Global events can quickly alter risk landscapes, requiring agile risk mapping processes
- Technological advancements introduce new risks that may be challenging to assess
Best practices
- Represent proven approaches to enhance the effectiveness of risk mapping efforts
- Support continuous improvement in risk management capabilities
- Facilitate integration of risk mapping into broader organizational processes
Regular updates and reviews
- Conduct periodic (quarterly, semi-annual) reviews of risk maps and assessments
- Establish formal processes for capturing and incorporating new risk information
- Align risk mapping updates with strategic planning and budgeting cycles
- Implement version control and change management for risk mapping documentation
- Conduct post-event analyses to refine risk assessments based on actual outcomes
Cross-functional collaboration
- Form diverse risk committees with representatives from various departments
- Implement collaborative risk identification and assessment workshops
- Develop common risk language and assessment criteria across the organization
- Encourage open communication and information sharing about potential risks
- Integrate risk mapping into project management and business planning processes
Technology integration
- Utilize specialized risk management software for data collection and analysis
- Implement data visualization tools to create interactive and dynamic risk maps
- Leverage artificial intelligence and machine learning for predictive risk analytics
- Integrate risk mapping tools with existing enterprise systems (ERP, CRM)
- Implement cybersecurity measures to protect sensitive risk data and analysis
Case studies
- Provide real-world examples of risk mapping applications and outcomes
- Offer valuable insights and lessons learned from diverse industries and scenarios
- Demonstrate the practical impact of effective risk mapping on organizational success
Industry-specific examples
- Financial services: Bank implements comprehensive risk mapping to comply with Basel III regulations
- Healthcare: Hospital system uses risk mapping to identify and mitigate patient safety risks
- Manufacturing: Automotive company applies risk mapping to manage complex supply chain risks
- Technology: Software firm utilizes risk mapping to address cybersecurity and data privacy concerns
- Energy: Oil and gas company employs risk mapping to manage environmental and safety risks
Lessons learned
- Early stakeholder engagement crucial for successful risk mapping implementation
- Importance of balancing quantitative data with qualitative expert judgment
- Need for flexibility in risk mapping processes to adapt to changing business environments
- Value of integrating risk mapping with other business processes for maximum impact
- Significance of leadership support in fostering a risk-aware organizational culture
Emerging trends
- Reflect the evolving landscape of risk mapping and management practices
- Highlight innovative approaches and technologies shaping the future of risk assessment
- Offer opportunities for organizations to enhance their risk mapping capabilities
Artificial intelligence in risk mapping
- Machine learning algorithms analyze vast datasets to identify emerging risk patterns
- Natural language processing extracts risk information from unstructured data sources
- AI-powered scenario analysis generates more comprehensive risk projections
- Automated risk classification and prioritization enhance efficiency and consistency
- Cognitive computing systems provide real-time risk insights and recommendations
Real-time risk monitoring
- IoT sensors and connected devices provide continuous data for dynamic risk assessment
- Cloud-based platforms enable instant updates to risk maps across global operations
- Mobile applications allow field personnel to report risk observations in real-time
- Social media monitoring tools capture emerging reputational and market risks
- Blockchain technology ensures secure and transparent risk data sharing
Predictive analytics
- Advanced statistical models forecast potential risk events and their impacts
- Prescriptive analytics suggest optimal risk response strategies
- Integration of external data sources (economic indicators, weather patterns) enhances predictive capabilities
- Behavioral analytics identify potential human-factor risks in processes and systems
- Simulation techniques model complex risk scenarios and their potential outcomes