A/B testing is a powerful tool in predictive analytics that allows businesses to compare two versions of a variable to determine which performs better. By systematically testing hypotheses and measuring impacts on key performance indicators, companies can optimize their products, services, and marketing strategies.
This method enables data-driven decision-making, helping businesses improve conversion rates, reduce risks, and enhance user experiences. A/B testing involves careful design, implementation, and analysis to ensure valid and reliable results that can drive meaningful improvements across various business functions.
Definition of A/B testing
- Systematic method in predictive analytics compares two versions of a variable to determine which performs better
- Crucial tool for data-driven decision making in business allows companies to optimize their products, services, and marketing strategies based on empirical evidence
- Enables businesses to make informed choices by testing hypotheses and measuring the impact of changes on key performance indicators
Purpose and objectives
- Improve conversion rates by identifying which version of a webpage, email, or product feature performs better
- Reduce risk in decision-making processes through data-backed insights
- Optimize user experience by testing different design elements, content, or functionality
- Increase return on investment (ROI) for marketing campaigns and product development efforts
Key terminology
- Control group represents the original version or current standard in the experiment
- Treatment group receives the new version or variation being tested
- Conversion rate measures the percentage of users who complete a desired action (purchasing, signing up, clicking)
- Statistical significance determines if the difference between control and treatment groups is meaningful or due to chance
- Confidence interval indicates the range of values that likely contains the true population parameter
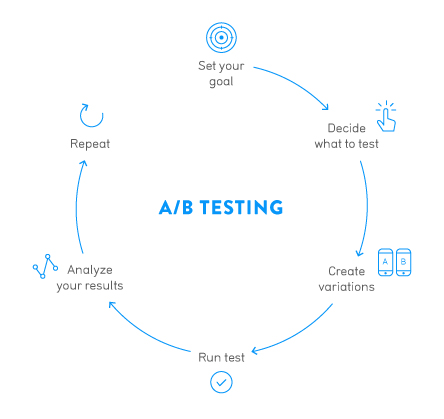
Design of A/B tests
- Crucial step in predictive analytics ensures the validity and reliability of test results
- Proper design minimizes bias and confounding factors that could skew the outcomes
- Lays the foundation for drawing accurate conclusions and making data-driven business decisions
Hypothesis formulation
- Null hypothesis (H0) assumes no significant difference between control and treatment groups
- Alternative hypothesis (H1) proposes a significant difference exists between the groups
- Directional hypotheses specify whether the treatment is expected to perform better or worse than the control
- Non-directional hypotheses only state that a difference exists without specifying the direction
Sample size determination
- Power analysis calculates the minimum sample size needed to detect a meaningful effect
- Considers factors such as desired effect size, statistical power, and significance level
- Larger sample sizes increase the precision of estimates and the ability to detect smaller effects
- Tools like power calculators help determine appropriate sample sizes for different test scenarios
Randomization techniques
- Simple randomization assigns participants to groups using methods like coin flips or random number generators
- Stratified randomization ensures balanced representation of important subgroups across control and treatment
- Block randomization groups participants into blocks before randomizing within each block
- Cluster randomization assigns groups of participants (clusters) rather than individuals to control or treatment
Control vs treatment groups
- Control group serves as a baseline for comparison represents the current standard or practice
- Treatment group receives the new version or variation being tested
- Importance of maintaining similarity between groups except for the variable being tested
- Use of placebo or sham treatments in some cases to control for psychological effects
Types of A/B tests
- Various applications of A/B testing in predictive analytics allow businesses to optimize different aspects of their operations
- Different types of tests cater to specific business needs and objectives
- Understanding the range of A/B tests helps companies choose the most appropriate method for their goals
Website A/B testing
- Tests different versions of webpage elements (headlines, images, call-to-action buttons)
- Measures impact on user engagement metrics (bounce rate, time on page, click-through rate)
- Evaluates changes in site navigation or layout to improve user experience
- Tests loading speed optimizations and their effect on conversion rates
Email marketing tests
- Compares different subject lines to improve open rates
- Tests variations in email content, layout, or design to increase click-through rates
- Experiments with personalization techniques to enhance engagement
- Evaluates the effectiveness of different calls-to-action or offers within emails
Product feature experiments
- Tests new features or functionality against existing versions
- Measures user adoption rates and satisfaction with different product variations
- Evaluates the impact of feature changes on key performance indicators (usage time, retention)
- Compares different pricing models or subscription plans to optimize revenue
Statistical foundations
- Essential component of A/B testing in predictive analytics ensures the validity and reliability of test results
- Provides the framework for making inferences about the population based on sample data
- Helps businesses quantify the uncertainty associated with their test results and make informed decisions
Significance levels
- Commonly set at 5% (0.05) or 1% (0.01) depending on the desired level of confidence
- Represents the probability of rejecting the null hypothesis when it is actually true (Type I error)
- Lower significance levels (1%) provide stronger evidence against the null hypothesis
- Balances the trade-off between false positives and false negatives in decision-making
P-values and confidence intervals
- P-value measures the probability of obtaining results as extreme as observed, assuming the null hypothesis is true
- Smaller p-values indicate stronger evidence against the null hypothesis
- Confidence intervals provide a range of plausible values for the true population parameter
- 95% confidence interval means we can be 95% confident that the true population parameter falls within this range
Type I vs Type II errors
- Type I error (false positive) occurs when rejecting a true null hypothesis
- Probability of Type I error equals the significance level (α)
- Type II error (false negative) occurs when failing to reject a false null hypothesis
- β represents the probability of a Type II error, while power (1-β) is the probability of correctly rejecting a false null hypothesis
Implementation process
- Critical phase in predictive analytics ensures the successful execution of A/B tests
- Proper implementation minimizes bias and ensures the collection of reliable data
- Structured approach to implementation enhances the validity of test results and facilitates accurate decision-making
Test planning
- Define clear objectives and key performance indicators (KPIs) for the test
- Determine the minimum detectable effect size based on business goals and resources
- Create a detailed timeline for test execution, data collection, and analysis
- Identify potential confounding variables and develop strategies to control for them
Data collection methods
- Server-side tracking captures data directly on the web server or application backend
- Client-side tracking uses JavaScript to collect data on the user's browser or device
- Implement data validation checks to ensure the accuracy and completeness of collected information
- Use unique identifiers to track individual users across multiple sessions or interactions
Duration of experiments
- Calculate the minimum test duration based on sample size requirements and expected traffic
- Consider seasonality and other temporal factors that may affect test results
- Implement stopping rules to prevent premature conclusion of tests or running tests for too long
- Balance the need for statistical significance with business constraints and opportunity costs
Analysis and interpretation
- Crucial step in predictive analytics transforms raw data into actionable insights
- Rigorous analysis ensures the validity of conclusions drawn from A/B tests
- Proper interpretation of results guides data-driven decision-making in business contexts
Statistical analysis techniques
- T-tests compare means between two groups for continuous variables
- Chi-square tests analyze differences in proportions for categorical variables
- ANOVA (Analysis of Variance) evaluates differences among multiple groups
- Regression analysis examines relationships between variables and controls for confounding factors
Interpreting test results
- Evaluate statistical significance based on p-values and predetermined significance levels
- Consider practical significance by assessing the magnitude of observed effects
- Analyze confidence intervals to understand the precision of estimated effects
- Account for multiple comparisons when interpreting results from tests with multiple variants
Drawing actionable insights
- Translate statistical findings into clear, business-relevant recommendations
- Assess the potential impact of implementing changes based on test results
- Identify areas for further investigation or follow-up tests
- Consider the long-term implications of test results on overall business strategy
Advanced A/B testing concepts
- Extends the capabilities of traditional A/B testing in predictive analytics
- Allows for more complex experimental designs and analysis methods
- Enables businesses to gain deeper insights and make more nuanced decisions based on test results
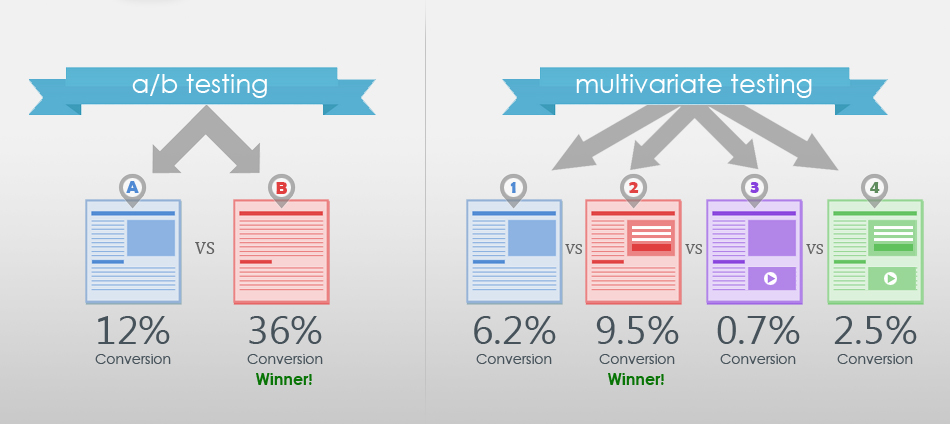
Multivariate testing
- Tests multiple variables simultaneously to identify optimal combinations
- Factorial design examines all possible combinations of variables
- Fractional factorial design tests a subset of combinations to reduce complexity
- Taguchi method optimizes product design by focusing on key factors and interactions
Sequential testing
- Allows for interim analyses and early stopping of tests based on predefined criteria
- Group sequential design divides the sample into groups and analyzes data at predetermined intervals
- Adaptive designs modify test parameters based on interim results
- Helps balance the trade-off between test duration and statistical power
Bayesian vs frequentist approaches
- Frequentist approach relies on p-values and confidence intervals
- Bayesian methods incorporate prior beliefs and update probabilities as new data is collected
- Bayesian A/B testing allows for continuous monitoring and flexible stopping rules
- Provides more intuitive interpretation of results in terms of probabilities of superiority
Limitations and challenges
- Understanding the constraints of A/B testing in predictive analytics helps businesses interpret results accurately
- Awareness of limitations allows for the development of strategies to mitigate potential issues
- Recognizing challenges enables more robust experimental designs and analysis methods
External validity concerns
- Results may not generalize to different populations or contexts
- Interaction effects between variables may limit the applicability of findings
- Temporal effects can impact the long-term validity of test results
- Cultural or regional differences may affect the generalizability of findings
Sample bias issues
- Selection bias occurs when the sample does not represent the target population
- Participation bias arises when certain groups are more likely to participate in the test
- Survivorship bias can skew results if dropouts are not accounted for
- Sampling error increases with smaller sample sizes, reducing the reliability of results
Multiple testing problem
- Increased risk of false positives when conducting multiple tests simultaneously
- Family-wise error rate (FWER) represents the probability of making at least one Type I error
- Bonferroni correction adjusts the significance level for multiple comparisons
- False discovery rate (FDR) controls the proportion of false positives among all rejected null hypotheses
Tools and platforms
- Essential resources in predictive analytics facilitate the implementation and analysis of A/B tests
- Variety of tools cater to different business needs, budgets, and technical expertise levels
- Selection of appropriate tools enhances the efficiency and effectiveness of A/B testing programs
Popular A/B testing software
- Google Optimize integrates with Google Analytics for website testing
- Optimizely provides a comprehensive platform for experimentation across web, mobile, and connected devices
- VWO (Visual Website Optimizer) offers a user-friendly interface for website optimization
- Unbounce specializes in landing page A/B testing and optimization
Open-source vs proprietary solutions
- Open-source tools (Apache PredictionIO) offer flexibility and customization options
- Proprietary solutions (Adobe Target) provide comprehensive support and integration with other marketing tools
- Open-source options may require more technical expertise to implement and maintain
- Proprietary platforms often offer more user-friendly interfaces and pre-built integrations
Ethical considerations
- Crucial aspect of A/B testing in predictive analytics ensures responsible and ethical use of data
- Adherence to ethical principles builds trust with customers and stakeholders
- Ethical considerations help mitigate legal and reputational risks associated with data-driven experimentation
Privacy concerns
- Collect only necessary data to minimize privacy risks
- Implement robust data protection measures to safeguard user information
- Comply with relevant data protection regulations (GDPR, CCPA)
- Consider the potential impact of personalization on user privacy
Informed consent
- Provide clear information about the nature and purpose of A/B tests
- Obtain explicit consent for participation in experiments when appropriate
- Allow users to opt-out of testing if desired
- Consider the ethical implications of testing without explicit consent in certain contexts
Transparency in reporting
- Disclose the use of A/B testing to users and stakeholders
- Report both positive and negative results to avoid publication bias
- Clearly communicate the limitations and potential biases in test results
- Share methodologies and data analysis techniques to enable replication and validation
A/B testing in business
- Integral part of data-driven decision making in modern business strategies
- Enables companies to optimize various aspects of their operations based on empirical evidence
- Contributes to continuous improvement and innovation across different business functions
Applications across industries
- E-commerce uses A/B testing to optimize product pages, checkout processes, and recommendation algorithms
- Financial services test different user interfaces for online banking platforms and investment tools
- Healthcare organizations experiment with patient engagement strategies and telemedicine interfaces
- Media companies optimize content recommendations and subscription offers
ROI of A/B testing
- Calculate the financial impact of implemented changes based on test results
- Consider both short-term gains and long-term benefits of optimization efforts
- Factor in the costs of implementing and maintaining A/B testing programs
- Evaluate the opportunity cost of not testing and potentially missing out on improvements
Integration with business strategy
- Align A/B testing initiatives with overall business objectives and key performance indicators
- Develop a culture of experimentation and data-driven decision making across the organization
- Use A/B testing insights to inform product development and marketing strategies
- Incorporate A/B testing results into long-term strategic planning and forecasting