Dimensionality reduction techniques help simplify complex datasets while preserving important information. Linear methods like PCA maintain global structure, while non-linear approaches like t-SNE and UMAP capture intricate local relationships, offering more flexibility but with increased computational demands.
t-SNE and UMAP are powerful tools for visualizing high-dimensional data in lower dimensions. These techniques differ in their underlying algorithms and performance characteristics, with UMAP generally offering faster processing and better preservation of global structure compared to t-SNE.
Linear vs Non-Linear Dimensionality Reduction
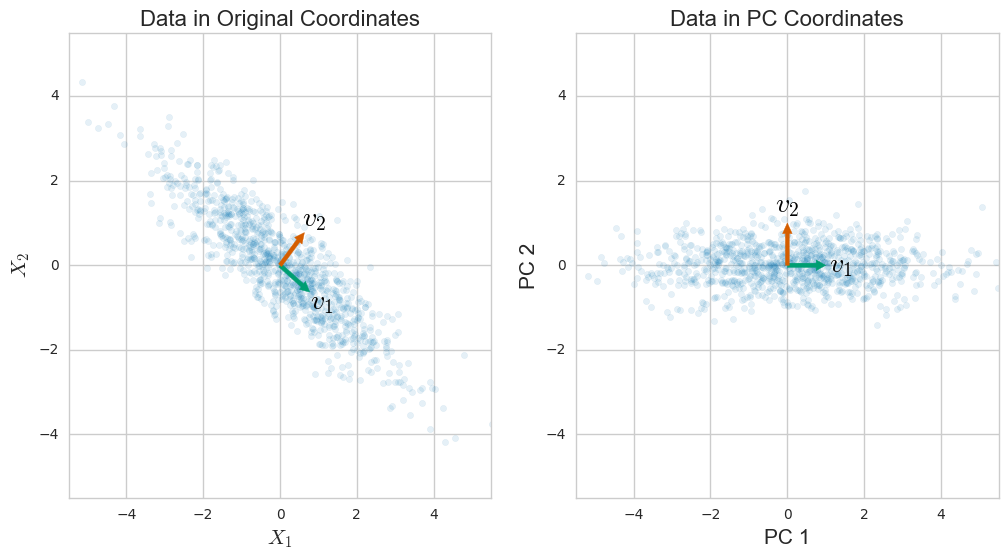
Linear vs non-linear dimensionality reduction
- Linear techniques preserve global structure, assume linear feature relationships (PCA, LDA)
- Non-linear techniques preserve local structure, capture complex relationships (t-SNE, UMAP, Isomap, LLE)
- Key differences: flexibility in capturing relationships, computational complexity, result interpretability
![Linear vs non-linear dimensionality reduction, t-SNE in Python [single cell RNA-seq example and hyperparameter optimization] - Renesh Bedre](https://storage.googleapis.com/static.prod.fiveable.me/search-images%2F%22Linear_vs_non-linear_dimensionality_reduction_comparison_PCA_t-SNE_UMAP_global_local_structure_visualization%22-tsne_teaser.png.)
t-SNE and UMAP
Visualization with t-SNE
- t-SNE converts high-dimensional distances to conditional probabilities
- Uses Student's t-distribution for low-dimensional similarities
- Key steps: compute pairwise similarities, initialize embedding, optimize with gradient descent
- Hyperparameters: perplexity balances local/global structure, learning rate affects convergence
- Visualize with scatter plots, color-code points by classes or clusters
Concepts and parameters of UMAP
- Based on topological data analysis and manifold learning
- Constructs fuzzy topological representation of high-dimensional data
- Key concepts: Riemannian geometry, metric spaces, simplicial complexes, fuzzy simplicial sets
- Workflow: construct fuzzy representation, create low-dimensional representation, optimize layout
- Hyperparameters: neighbors affect structure preservation, minimum distance controls point packing, epochs balance quality and computation time
t-SNE vs UMAP for datasets
- Both non-linear techniques preserve local structure, visualize high-dimensional data
- Algorithms differ: t-SNE uses probabilistic approach, UMAP uses manifold learning
- UMAP faster, better at preserving global structure, more scalable to large datasets
- UMAP results more stable across runs, t-SNE can vary due to random initialization
- t-SNE often preferred for single-cell RNA sequencing, UMAP better for datasets with meaningful global structure