📈College Algebra Unit 11 Review
11.3 Systems of Nonlinear Equations and Inequalities: Two Variables
11.3 Systems of Nonlinear Equations and Inequalities: Two Variables
Unit & Topic Study Guides
Prerequisites
Equations and Inequalities
Functions
Linear Functions
Polynomial and Rational Functions
Exponential and Logarithmic Functions
The Unit Circle: Sine and Cosine
Trigonometric Identities and Equations
Further Applications of Trigonometry
Systems of Equations and Inequalities
Analytic Geometry
Sequences, Probability, and Counting
Solving Systems of Nonlinear Equations
A nonlinear system of equations is a system where at least one equation isn't a straight line. Think circles, parabolas, ellipses, or any curve paired with another equation. Solving these systems means finding every point where the graphs intersect.
The same core methods you've used for linear systems (substitution, elimination, graphing) still apply here, but the algebra gets more involved, and you can end up with zero, one, two, or even more solutions.
Substitution Method
Substitution tends to be the go-to approach for nonlinear systems, especially when one equation is already solved (or easily solved) for a variable.
- Isolate one variable in whichever equation makes it easiest.
- Substitute that expression into the other equation.
- Solve the resulting single-variable equation. Since the system is nonlinear, this often means solving a quadratic (or higher-degree) equation, so expect to factor or use the quadratic formula.
- Back-substitute each solution into the isolation equation to find the corresponding value of the other variable.
- Write your solutions as ordered pairs and check them in both original equations.
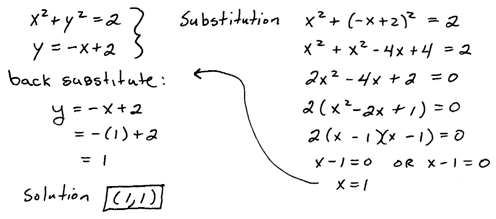
Example: Solve and .
Substitute into the second equation:
So or . Back-substituting: and .
Elimination Method
Elimination works well when both equations contain the same nonlinear term (like or ) and you can cancel it out by adding or subtracting.
- Multiply one or both equations by constants so that one variable's terms will cancel.
- Add or subtract the equations to eliminate that variable.
- Solve the resulting equation for the remaining variable.
- Substitute back into either original equation to find the other variable.
- Check all solutions in both original equations.
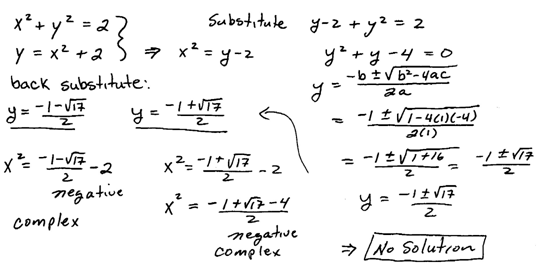
Example: Solve and .
The second equation gives . Substituting into the first: , which simplifies to . You could also subtract equations directly if the terms line up. Either way, you're reducing the system to one variable.
Graphing Method
Plot both equations and look for intersection points. This is most useful for estimating solutions or confirming algebraic answers visually. A line and a parabola can intersect at 0, 1, or 2 points. Two conics (circles, ellipses, hyperbolas) can intersect at up to 4 points.
How Many Solutions Can You Get?
Unlike linear systems (which give 0, 1, or infinitely many solutions), nonlinear systems have more possibilities:
- No solution: The graphs never intersect (e.g., a small circle entirely inside a larger one with no contact).
- One solution: The graphs touch at exactly one point (e.g., a line tangent to a circle).
- Two or more solutions: Common when a line crosses a parabola or two conics overlap at multiple points.
- Infinitely many solutions: The equations describe the same curve.
Always expect multiple solutions and solve completely. Don't stop after finding one value of .
Graphing and Applying Systems of Nonlinear Inequalities
A system of nonlinear inequalities asks: where on the coordinate plane do all the inequalities hold true at the same time? The answer is a region, not a set of points.
How to Graph Nonlinear Inequalities
-
Replace the inequality with an equals sign and graph the boundary curve (parabola, circle, etc.).
- Use a dashed curve for strict inequalities ( or ) because points on the boundary aren't included.
- Use a solid curve for inclusive inequalities ( or ).
-
Pick a test point not on the boundary (the origin is convenient if it's not on the curve). Plug it into the original inequality.
- If the test point satisfies the inequality, shade the side of the curve that contains it.
- If it doesn't, shade the opposite side.
-
Repeat for every inequality in the system.
-
The solution region is where all the shaded areas overlap. Only that overlapping region satisfies every inequality simultaneously.
For , you shade above the curve. For , you shade below. But when the boundary isn't a function (like a circle ), the test-point method is more reliable than trying to remember "above" or "below."
Solving Application Problems
Real-world problems involving nonlinear systems follow a consistent process:
-
Define your variables clearly (what does represent? what does represent?).
-
Translate the given information into equations or inequalities. Look for relationships like area (), distance (), or cost/revenue curves.
-
Solve the system algebraically or graph the inequality system.
-
Interpret your answer in context:
- For equations, solutions are specific values (a price of $12 and a quantity of 50 units, for instance).
- For inequalities, the solution is a range of acceptable values (all combinations of length and width that keep area under 200 square feet, for example).
-
Reject nonsensical solutions. If the problem involves physical quantities, negative values for length or time don't make sense, even if the algebra produces them.