The Cartesian coordinate system is the foundation for graphing in algebra. It lets you plot points and equations on a two-dimensional plane, using x and y coordinates to pinpoint locations. This matters because nearly everything in later math builds on reading and interpreting graphs.
This section covers the coordinate plane itself, how to find intercepts, and two key formulas you'll use constantly: the distance formula and the midpoint formula.
The Cartesian Coordinate System
Points in Cartesian coordinates
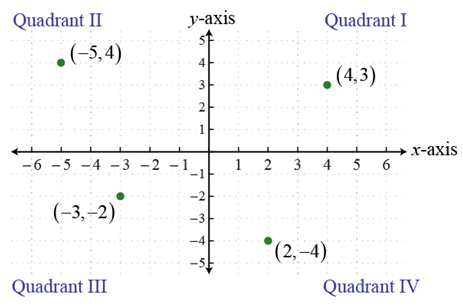
The Cartesian plane is formed by two number lines crossing at right angles. The horizontal line is the x-axis, the vertical line is the y-axis, and they meet at the origin, which has coordinates (0, 0). This intersection divides the plane into four regions called quadrants, numbered I through IV counterclockwise starting from the upper right.
Every point on the plane is described by an ordered pair :
- The x-coordinate tells you horizontal distance from the origin (positive = right, negative = left)
- The y-coordinate tells you vertical distance from the origin (positive = up, negative = down)
To plot a point, start at the origin, move horizontally by the x-value, then vertically by the y-value. For example, means 3 units right and 4 units up, while means 2 units left and 5 units down.
The quadrant a point falls in depends on the signs of its coordinates:
| Quadrant | x-sign | y-sign | Example |
|---|---|---|---|
| I | + | + | (3, 4) |
| II | - | + | (-2, 5) |
| III | - | - | (-3, -1) |
| IV | + | - | (4, -6) |
Points on the axes themselves don't belong to any quadrant.
Graphing equations with technology
The most straightforward way to graph an equation is by plotting points:
- Choose several x-values and substitute them into the equation to find corresponding y-values.
- Organize these as ordered pairs in a table.
- Plot each point on the coordinate plane.
- Connect the points with a smooth curve or straight line, depending on the equation type.
For example, to graph , you might pick , which gives you the points , , , . Since this is a linear equation, the points form a straight line.
Graphing calculators and software can do this much faster. You enter the equation, adjust the window settings so the important parts of the graph are visible, and the tool plots it for you. This is especially useful for more complex equations like , where plotting by hand requires more points to capture the curved shape.

Interpreting Graphs
Intercepts of graphs
Intercepts are the points where a graph crosses the axes. They're often the easiest features to find and give you quick information about an equation's behavior.
- x-intercept: where the graph crosses the x-axis. At this point, . To find it, set in the equation and solve for .
- y-intercept: where the graph crosses the y-axis. At this point, . To find it, set in the equation and solve for .
Example: Find the intercepts of .
- x-intercept: Set , so , which gives . The x-intercept is .
- y-intercept: Set , so . The y-intercept is .
A graph can have more than one x-intercept (parabolas often do), but a function will only ever have one y-intercept.
Distance formula for lengths
The distance formula calculates the straight-line distance between two points and . It comes directly from the Pythagorean theorem: the horizontal and vertical distances between the points form the legs of a right triangle, and the distance between the points is the hypotenuse.
Steps to use it:
- Identify the coordinates of both points.
- Subtract the x-values and square the result.
- Subtract the y-values and square the result.
- Add those two squares, then take the square root.
Example: Find the distance between and .
A common mistake is forgetting to square the differences before adding. If you just add , you'll get the wrong answer.
Midpoint formula for segments
The midpoint formula finds the point exactly halfway between two endpoints. It works by averaging the x-coordinates and averaging the y-coordinates separately.
For endpoints and :
Steps to use it:
- Add the two x-coordinates and divide by 2.
- Add the two y-coordinates and divide by 2.
- Write the result as an ordered pair.
Example: Find the midpoint of the segment with endpoints and .
You can check your answer: the midpoint should be "between" the two endpoints for both coordinates. Here, 1 is between -3 and 5, and 4 is between 1 and 7.
Information from graph analysis
The shape of a graph tells you what type of equation you're dealing with:
- Linear equations produce straight lines
- Quadratic equations produce parabolas (U-shaped curves)
- Exponential equations produce curves that increase or decrease rapidly
Beyond shape, look for these key features when analyzing a graph:
- Intercepts (where the graph crosses each axis)
- Symmetry (does the graph mirror itself across an axis or a point?)
- Increasing or decreasing behavior (is the graph going up or down as you move left to right?)
- Turning points (maximums or minimums, where the graph changes direction)
These features help you make predictions. For instance, if a parabola opens upward, its leading coefficient is positive and it has a minimum point. A line with a positive slope represents an increasing relationship between the variables.
Functions and their properties
A function is a rule that assigns each input value to exactly one output value. On a graph, you can test this with the vertical line test: if any vertical line crosses the graph more than once, it's not a function.
Two properties you'll work with constantly:
- Domain: the set of all possible input values (x-values) for the function
- Range: the set of all possible output values (y-values) the function produces
On a graph, the domain is the horizontal extent (how far left and right the graph stretches), and the range is the vertical extent (how far up and down it reaches). For example, the function has a domain of all real numbers (you can square any number), but its range is because squaring always gives a non-negative result.