The coordinate plane is like a map for math. It uses two number lines to pinpoint locations with (x, y) coordinates. This system divides space into four quadrants, each with its own sign rules for x and y values.
Linear equations and inequalities create straight lines or shaded regions on this map. By plotting points and connecting them, we can visualize these mathematical relationships. Understanding slopes, intercepts, and half-planes helps us navigate this mathematical landscape.
Graphing in the Coordinate Plane
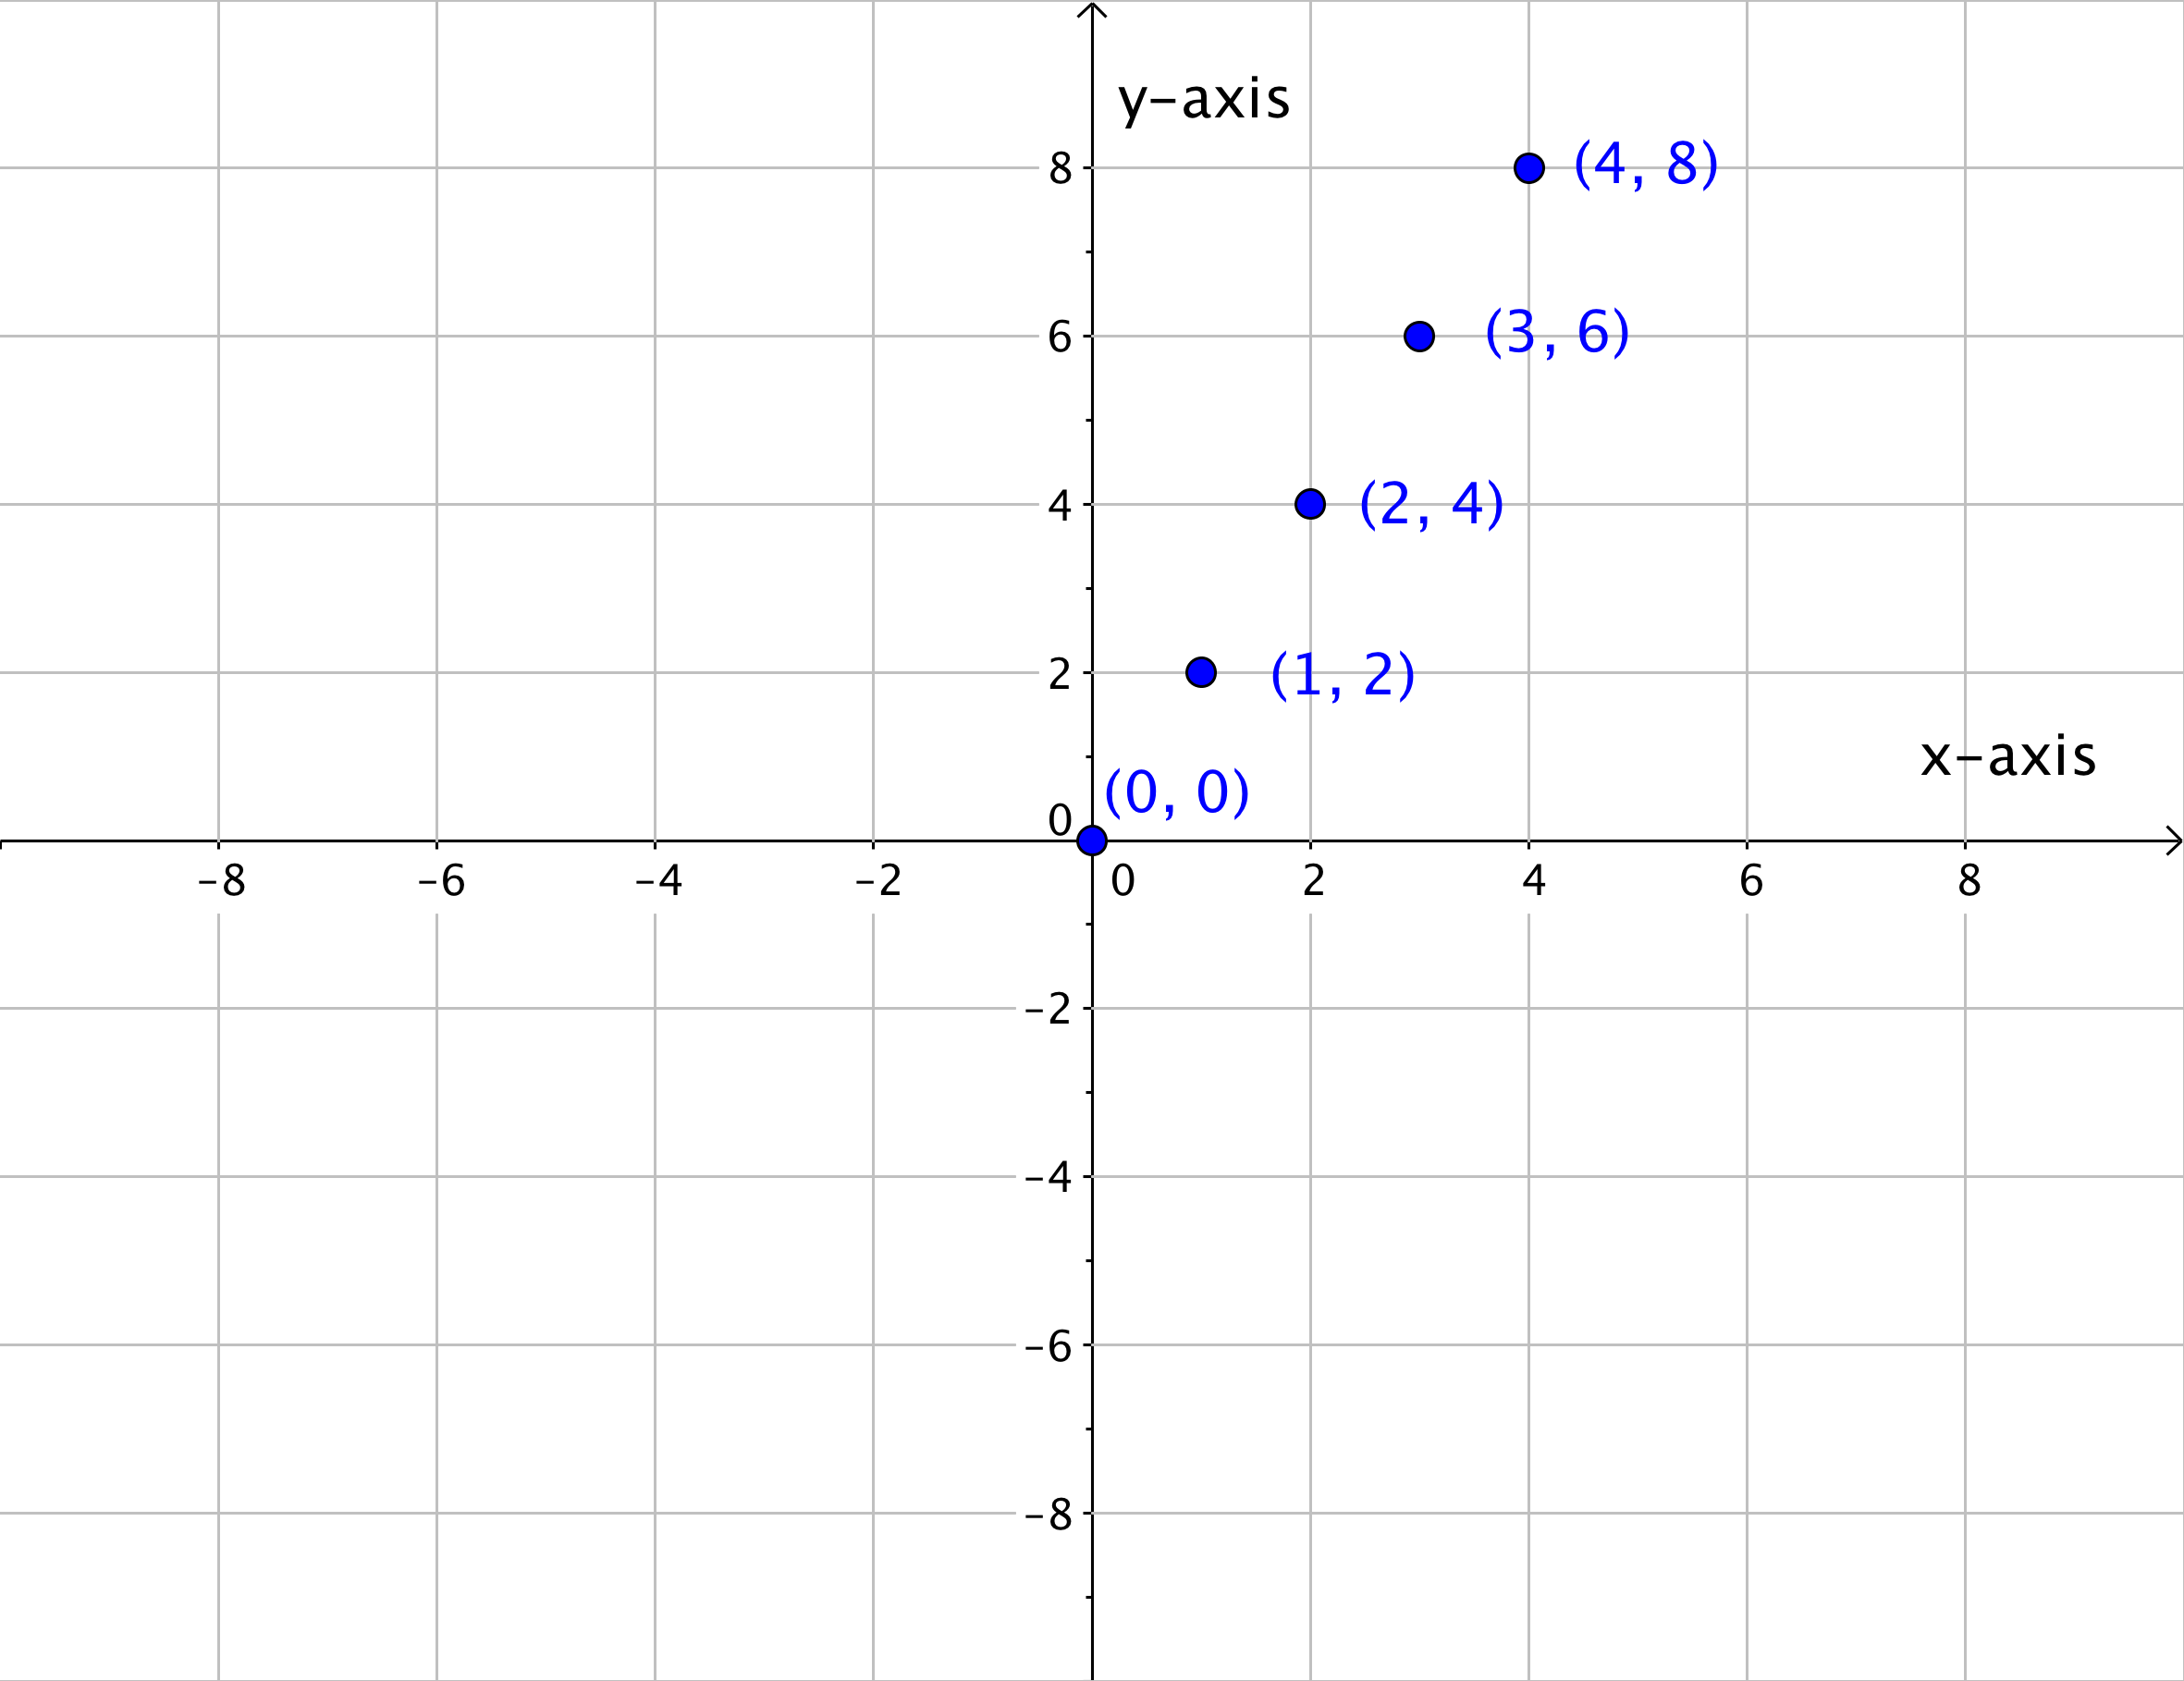
Plotting points in coordinate systems
- Rectangular coordinate system (Cartesian coordinate system) forms a two-dimensional plane by intersecting a horizontal number line (x-axis) and a vertical number line (y-axis)
- Origin is the point where the x-axis and y-axis intersect with coordinates (0, 0)
- Points on the coordinate plane represented by ordered pairs (x, y) where x is the horizontal coordinate and y is the vertical coordinate
- Coordinate plane divided into four quadrants by the x-axis and y-axis
- Quadrant I: x > 0 and y > 0 (upper right)
- Quadrant II: x < 0 and y > 0 (upper left)
- Quadrant III: x < 0 and y < 0 (lower left)
- Quadrant IV: x > 0 and y < 0 (lower right)
Graphing Linear Equations and Inequalities

Graphing linear equations
- Linear equation in two variables, x and y, written in the form where a, b, and c are real numbers and a and b are not both zero
- Graphing a linear equation:
- Find at least two solutions (x, y) that satisfy the equation
- Choose values for x and solve for y, or choose values for y and solve for x
- Plot the solutions as points on the coordinate plane
- Connect the points with a straight line
- Find at least two solutions (x, y) that satisfy the equation
- Graph of a linear equation is a straight line extending infinitely in both directions
- The slope of the line represents the rate of change between x and y coordinates
- The y-intercept is the point where the line crosses the y-axis (x = 0)
- The x-intercept is the point where the line crosses the x-axis (y = 0)
Linear inequalities on coordinate planes
- Linear inequality in two variables, x and y, written in one of four forms:
- Graphing a linear inequality:
- Graph the related linear equation as a dashed line
- If the inequality is strict (< or >), the dashed line is not included in the solution
- If the inequality is inclusive (≤ or ≥), the dashed line is included in the solution, so it should be a solid line
- Shade the half-plane that satisfies the inequality
- If y is isolated, shade above the line for > or ≥, and below the line for < or ≤
- If y is not isolated, test a point not on the line to determine which half-plane to shade
- Graph the related linear equation as a dashed line
- Graph of a linear inequality is a shaded half-plane extending infinitely in all directions, bounded by the line representing the related equality
Relationships between lines
- Parallel lines have the same slope but different y-intercepts
- Perpendicular lines have slopes that are negative reciprocals of each other