📘Intermediate Algebra Unit 9 Review
9.8 Solve Quadratic Inequalities
9.8 Solve Quadratic Inequalities
Unit & Topic Study Guides
Foundations
Solving Linear Equations
Graphs and Functions
Systems of Linear Equations
Polynomials and Polynomial Functions
Factoring
Rational Expressions and Functions
Roots and Radicals
Quadratic Equations and Functions
Exponential & Logarithmic Functions
Conics
Sequences, Series & Binomial Theorem
Solving Quadratic Inequalities
A quadratic inequality asks you to find which x-values make a quadratic expression positive, negative, or zero. Instead of solving for exact values like a quadratic equation does, you're solving for entire ranges of x-values. The two main approaches are graphical (using the parabola) and algebraic (using a sign chart).
The discriminant plays a supporting role here: it tells you how many times the parabola crosses the x-axis, which directly shapes what your solution set looks like.
Graphical Solutions for Quadratic Inequalities
A quadratic inequality takes one of these forms:
where , , and are real numbers and .
To solve graphically, you sketch the parabola and read the answer off the graph. Here's the process:
- Find the x-intercepts by setting and solving for . These are the boundary points of your solution.
- Determine the direction the parabola opens. If , it opens upward (U-shape). If , it opens downward (∩-shape).
- Identify the relevant region. For or , you want where the parabola is above the x-axis. For or , you want where it's below the x-axis.
- Read off the x-values that fall in that region. These x-values are your solution set.
- Handle endpoints. If the inequality is strict ( or ), the x-intercepts themselves are not included. If it's or , they are included.
Express your final answer in interval notation.
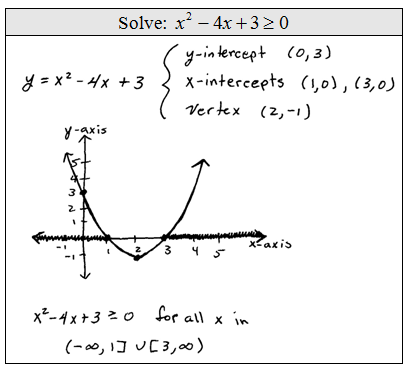
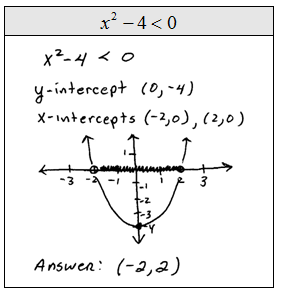
For example, if the parabola opens upward and crosses the x-axis at and , the parabola is below the x-axis between those points. So has the solution , while has the solution .
Algebraic Techniques for Quadratic Inequalities
You don't always need a graph. A sign chart (also called a number line test) gives you the same answer algebraically.
-
Find the critical points. Set and solve using factoring, the quadratic formula , or completing the square. The solutions are your critical points.
-
Plot the critical points on a number line. They divide the number line into intervals (two critical points create three intervals).
-
Pick a test point in each interval. Choose any x-value within the interval and plug it into the quadratic expression. You only need to determine whether the result is positive or negative.
-
Record the sign for each interval on your chart (+ or −).
-
Select the intervals that match your inequality. If you need , take the intervals marked +. If you need , take the intervals marked −.
-
Handle endpoints. For or , include the critical points in your solution (use brackets in interval notation). For or , exclude them (use parentheses).
A quick shortcut: if (parabola opens up), the expression is negative between the two roots and positive outside them. If (parabola opens down), it's the reverse. This pattern can save you time on test points, but the sign chart confirms it every time.
Discriminant in Quadratic Inequality Solutions
The discriminant is the expression from under the square root in the quadratic formula. It tells you how many x-intercepts the parabola has, which directly affects the shape of your solution set.
-
(positive): Two distinct real roots. The parabola crosses the x-axis twice, creating three intervals to analyze. Most standard problems fall here.
-
(zero): One repeated real root. The parabola just touches the x-axis at one point. The solution to (when ) would be all real numbers except that one point; the solution to would be just that single point.
-
(negative): No real roots. The parabola never crosses the x-axis, so it's entirely above or entirely below. If , the expression is always positive, meaning gives all real numbers and gives the empty set . If , it's the opposite.
Checking the discriminant before you start solving can save you work. If it's negative, you already know the answer without building a sign chart.
Related Inequality Types
- Compound inequalities combine multiple inequality statements with "and" or "or." You might encounter these when a quadratic inequality solution splits into two intervals joined by "or."
- Absolute value inequalities can sometimes be rewritten as quadratic inequalities, especially when both sides are squared.
- Polynomial inequalities of degree 3 or higher follow the same sign-chart method. The difference is you'll have more critical points and more intervals to test. Mastering the quadratic case gives you the foundation for those.