🔦Electrical Circuits and Systems II Unit 3 Review
3.4 Asymptotic approximations in Bode plots
3.4 Asymptotic approximations in Bode plots
Unit & Topic Study Guides
AC Circuit Analysis: Steady-State Response
Phasors and Complex Impedance in Circuits
Frequency Response and Bode Plots
Resonance and Q Factor in Circuits
Coupled Circuits & Mutual Inductance
Three-Phase Circuits and Power Systems
Transformers: Ideal and Real-World Applications
Passive Filters: LP, HP, BP, and BS
Active Filters and Op Amp Applications
Laplace Transform in Circuit Analysis
Two-Port Networks: Parameters & Analysis
State-Space Analysis in Circuit Systems
Power Distribution and Factor Correction
Asymptotic approximations in Bode plots simplify complex frequency responses into straight lines. This method helps us quickly estimate how systems behave at different frequencies, using logarithmic scales for magnitude and frequency.
Low and high-frequency asymptotes represent system behavior below and above the corner frequency. Understanding these asymptotes and how they connect allows us to construct Bode plots efficiently, providing valuable insights into a system's frequency response characteristics.
Low and High-Frequency Asymptotes
Understanding Asymptotic Approximations
- Asymptotic approximation simplifies complex frequency response curves into straight lines
- Provides quick estimation of system behavior at different frequencies
- Utilizes logarithmic scales for both magnitude and frequency
- Consists of low-frequency and high-frequency asymptotes
- Accuracy improves as frequency moves away from corner frequency
Analyzing Low and High-Frequency Behaviors
- Low-frequency asymptote represents system response at frequencies much lower than corner frequency
- Remains constant (0 dB/decade slope) for frequencies below corner frequency
- High-frequency asymptote depicts system behavior at frequencies much higher than corner frequency
- Slope depends on system order (20 dB/decade for first-order, 40 dB/decade for second-order)
- Corner frequency marks transition point between low and high-frequency regions
- Straight-line approximation connects low and high-frequency asymptotes
- Actual response curve smoothly transitions between asymptotes near corner frequency
Constructing Bode Plots with Asymptotes
- Start by plotting low-frequency asymptote as horizontal line
- Identify corner frequency (break point) where response changes
- Draw high-frequency asymptote with appropriate slope from corner frequency
- Connect asymptotes with straight line at corner frequency
- Refine approximation by adjusting curve near corner frequency (3 dB down for first-order systems)
- Use multiple asymptotes for systems with multiple poles or zeros
- Combine individual asymptotes to create overall system response
System Order and Roll-Off
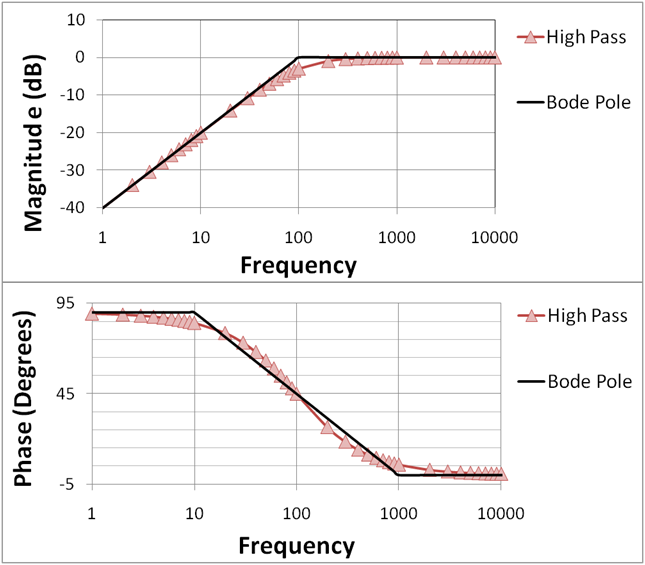
Characteristics of First-Order Systems
- First-order systems contain one energy storage element (capacitor or inductor)
- Transfer function has one pole
- Low-frequency asymptote remains flat (0 dB/decade)
- High-frequency asymptote has -20 dB/decade slope
- Corner frequency occurs at where τ is the time constant
- Phase shift ranges from 0° to -90° across frequency spectrum
- Examples include RC low-pass filter, RL high-pass filter
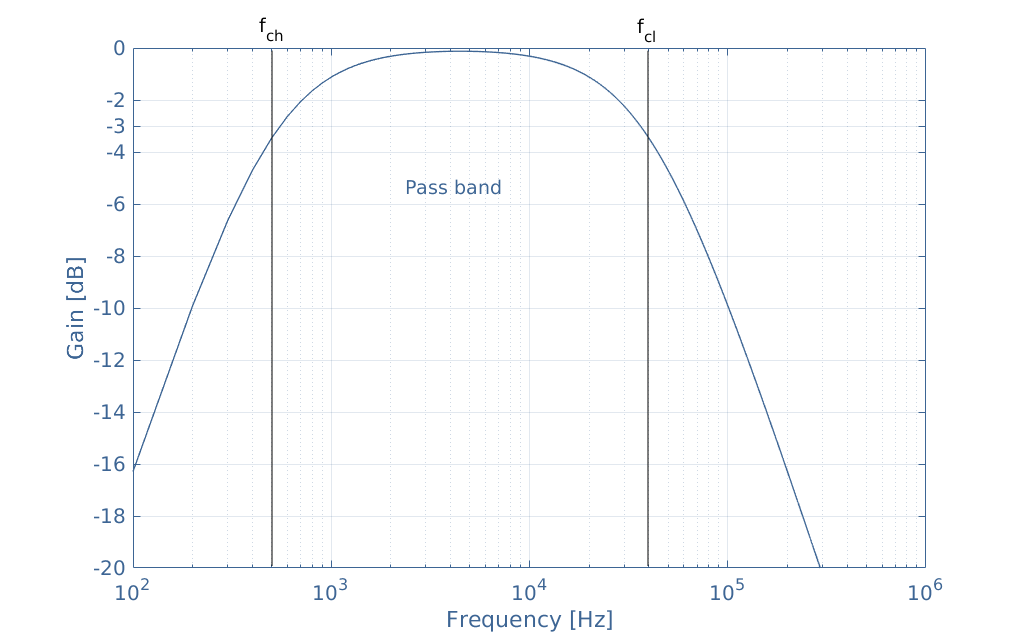
Analyzing Second-Order Systems
- Second-order systems have two energy storage elements
- Transfer function contains two poles
- Low-frequency asymptote stays flat (0 dB/decade)
- High-frequency asymptote exhibits -40 dB/decade slope
- Two corner frequencies possible, creating more complex response
- Phase shift spans from 0° to -180° across frequency range
- Damping factor influences peak resonance and overall response shape
- Examples include RLC circuits, mechanical mass-spring-damper systems
Understanding Roll-Off Rates
- Roll-off rate measures how quickly system attenuates signals beyond corner frequency
- Expressed in dB/decade or dB/octave
- First-order systems roll off at -20 dB/decade (-6 dB/octave)
- Second-order systems roll off at -40 dB/decade (-12 dB/octave)
- Higher-order systems have steeper roll-off rates (multiples of 20 dB/decade)
- Roll-off rate affects filter sharpness and ability to separate frequencies
- Steeper roll-off improves frequency selectivity but may introduce phase distortion
Pole-Zero Cancellation
Concept and Implications of Pole-Zero Cancellation
- Occurs when a pole and zero exist at same frequency in transfer function
- Mathematically cancels out, simplifying system order
- Reduces overall system complexity and changes frequency response
- Can potentially eliminate desirable system characteristics
- May result from improper system design or component tolerances
- Affects both magnitude and phase responses of system
Effects on System Behavior and Design Considerations
- Eliminates corner frequency associated with cancelled pole-zero pair
- Changes roll-off rate by reducing effective system order
- Can improve or degrade system stability depending on cancelled dynamics
- May remove filtering effects at specific frequencies
- Requires careful analysis to ensure desired system performance is maintained
- Can be intentionally used to shape frequency response (notch filters)
- Sensitivity to component variations may lead to incomplete cancellation in practice