Introduction to the Production Possibilities Curve (PPC)
The production possibilities curve is the first graph that we study in microeconomics. 📈 It shows us all of the possible production combinations of goods, given a fixed amount of resources. In eceonomic analysis we have to develop assumptions to be able to draw conclusions. For the Production possibilities curve we assume three things when we are working with these graphs:
- Only two goods can be produced
- Resources are fixed
- Technology is fixed
The production possibilities curve can illustrate several economic concepts including:

Efficiency
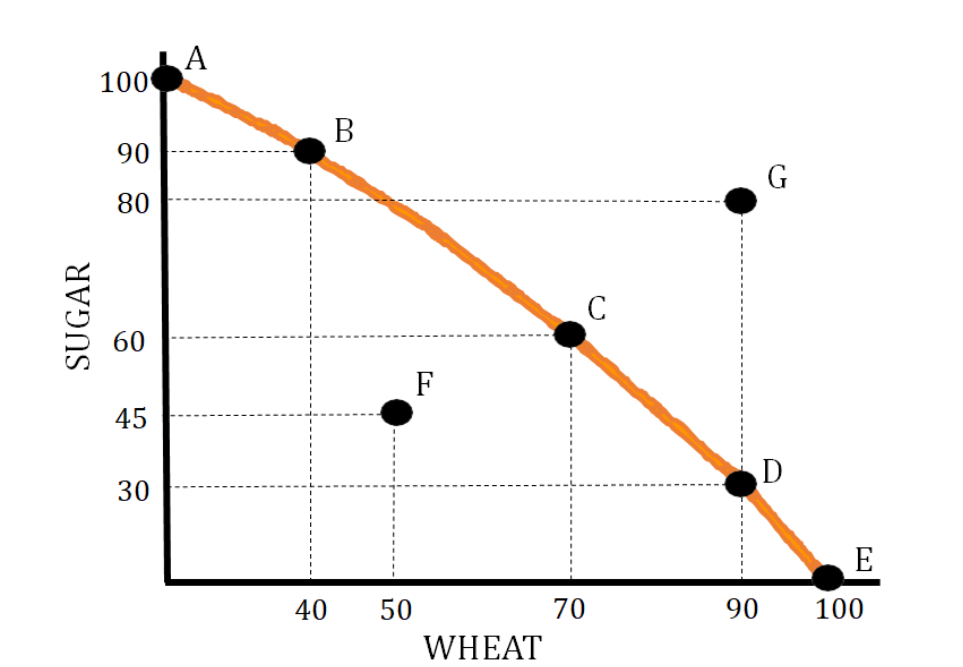
- Allocative Efficiency - This efficiency means we are producing at the point that society desires. This is represented by a point on the production possibilities curve that meets the desires and needs of a particular society. If you are given the situation where a particular society needs about an equal amount of sugar and wheat then the allocative efficient point would be C.
- Productive Efficiency - This efficiency means we are producing at a combination that minimizes costs. This is represented by any point on the production possibilities curve. In the below graph this is represented by points A, B, C, D, and E.
- Point F in the graph below represents an inefficient use of resources. You can produce at this point, but you are not using all your resources as efficiently as possible.
- Point G represents a production level that is unattainable. At this point, you do not have the needed amounts of resources to produce the number of goods shown.
- Any point below point F is considered extreme inefficiency and could be an indicator of a severe recession.
Scarcity
Since scarcity is a situation where there are limited resources versus unlimited wants, a production possibilities curve is used to show how we produce goods and services under this condition. This is shown in the graph above by showing how, given a fixed set of resources, we can produce either combination A, B, C, D, or E.
Opportunity Cost/Per-Unit Opportunity Cost
This is the value of the next best alternative. We represent this as what we are losing when we change our production combination. For example, moving from A to B on the graph above has an opportunity cost of 10 units of sugar. Per-unit opportunity cost is determined by dividing what you are giving up by what you are gaining. So for the graph above, the per-unit opportunity cost when moving from point A to point B is 1/4 unit of sugar (10 sugar / 40 wheat). Opportunity Cost can also be determined using a production possibilities table:
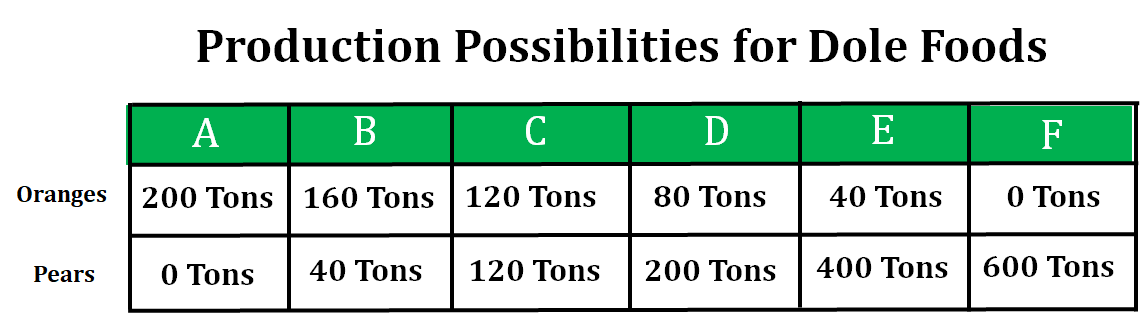
The opportunity cost of moving from point C to D is 40 tons of oranges. The per-unit opportunity cost of moving from point C to point D is 1/2 ton of oranges (40 tons of oranges/80 tons of pears).
Formulas to Calculate Opportunity Cost
The opportunity cost for GOOD X = Δ Good Y Production/Δ Good X Production
The opportunity cost for GOOD X = Time to Make 1 Unit of GOOD X/Time to Make 1 Unit of GOOD Y
Economic Growth
Economic growth is shown by a shift to the right of the production possibilities curve.
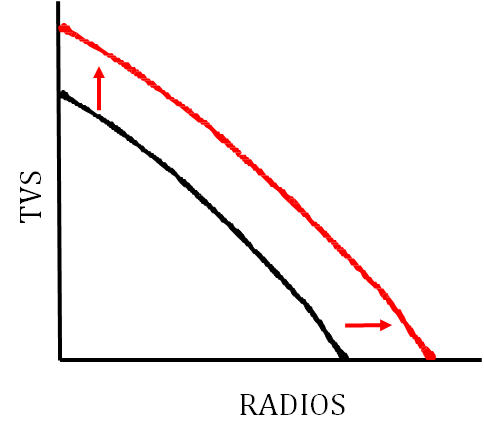
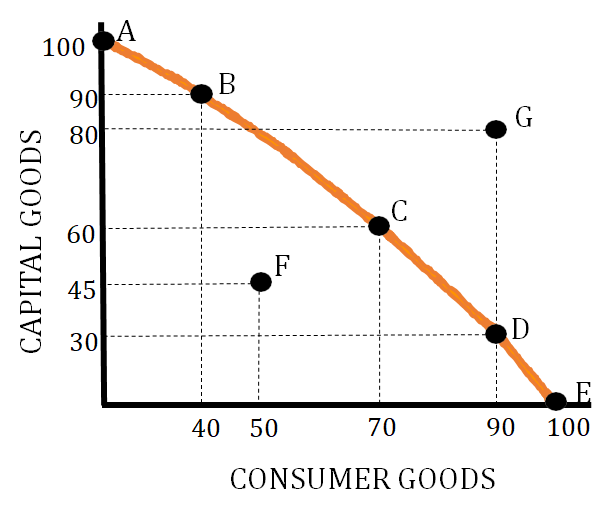
If a country produces more capital goods than consumer goods, the country will have greater economic growth in the future. If the country illustrated below produces at point B, they will see more economic growth than if they produce at point D. Since capital goods are tools and machinery, the increased production of them will lead to more production of consumer goods in the future, causing more economic growth.
Economic Contraction
Economic contraction is shown by a leftward shift of the production possibilities curve.
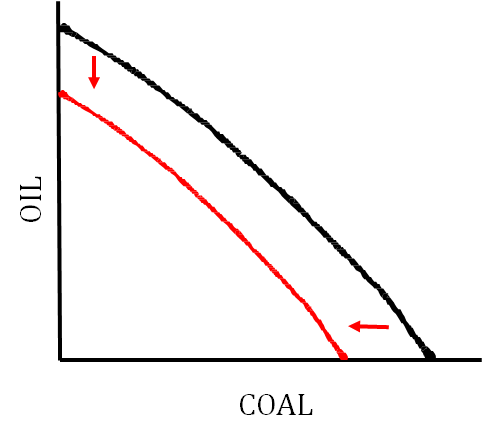
Constant Opportunity Cost vs. Increasing Opportunity Cost
The production possibilities curve can illustrate two types of opportunity costs. Increasing opportunity costs occurs when you produce more and more of one good and you give up more and more of another good. This occurs when resources are less adaptable when moving from the production of one good to the production of another good. Constant opportunity cost occurs when the opportunity cost stays the same as you increase your production of one good. This indicates that the resources are easily adaptable from the production of one good to the production of another good.
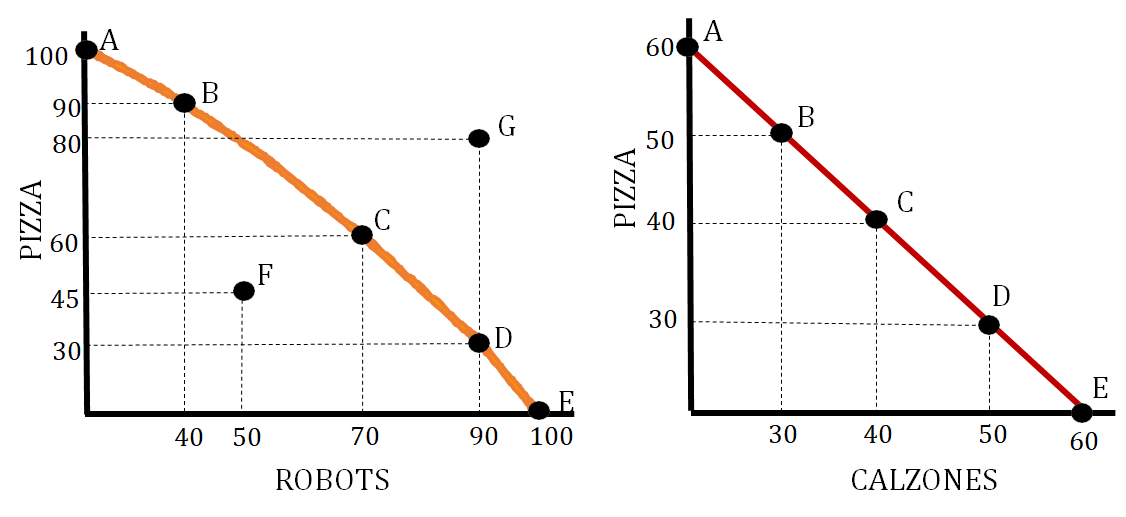
The graph on the left shows increasing opportunity cost and the graph on the right shows constant opportunity cost. The graph on the left shows increasing opportunity cost because as you move from point A to B you give up 10 pizzas but as you move from point B to C you give up 30 pizzas. The graph on the right shows constant opportunity costs because when you move from point A to point B you give up 10 pizzas and when you move from point B to point C you give up 10 pizzas.
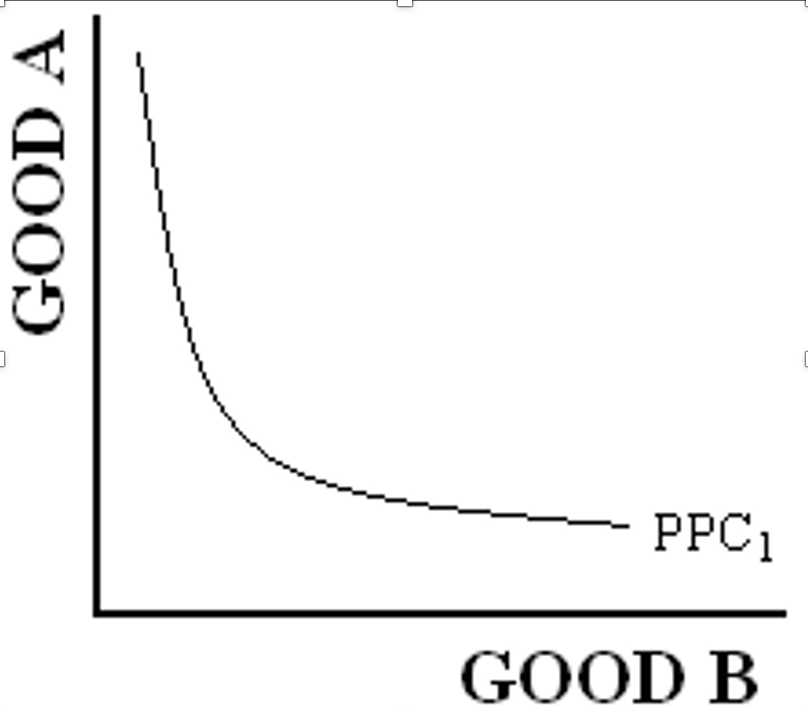
There is a nother type of graph which is the decreasing opportunity cost curve that is not possible in real life. This is what the graph looks like:
Shifters of the Production Possibilities Curve (PPC)
There are several factors that can cause the production possibilities curve to shift. These factors include:
-
Change in the quantity or quality of resources 🌍
-
Change in technology 💻
-
Trade 🔁
The production possibilities curve can show how these changes affect it as well as illustrate a change in productive efficiency and inefficiency.
Here are some scenarios that illustrate these shifters:
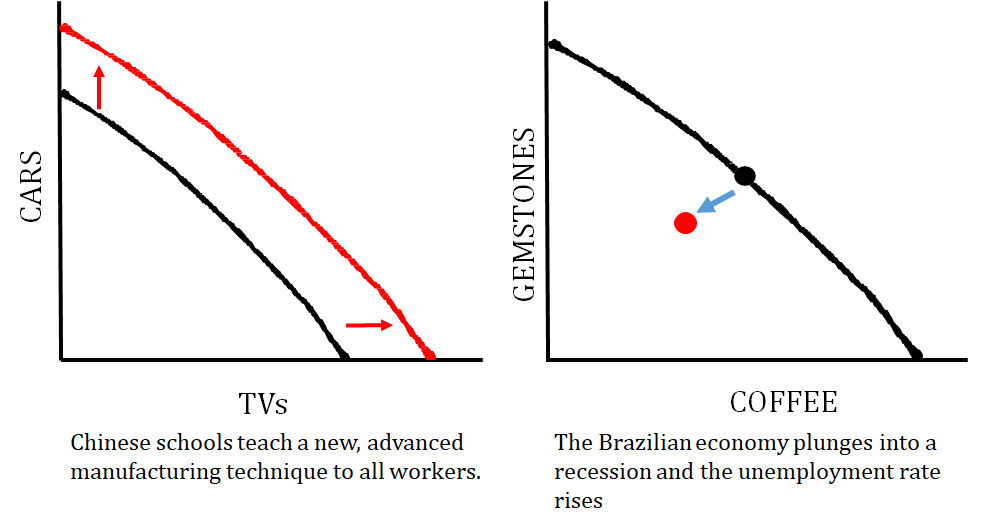
The graph on the left shows how an improvement in the quality of resources impacts the graph. The graph on the right shows what happens when a country is producing at an inefficient point.
The graph on the left shows a technology change that just impacts one good that a country produces, and the graph on the right shows what happens when the quantity of resources changes (i.e. number of workers decrease).
Vocabulary
The following words are mentioned explicitly in the College Board Course and Exam Description for this topic.
| Term | Definition |
|---|---|
| constant opportunity costs | A situation where the opportunity cost of producing one good remains the same regardless of the quantity produced, resulting in a linear PPC. |
| decreasing opportunity costs | A situation where the opportunity cost of producing one good decreases as more of that good is produced, resulting in a bowed-in PPC. |
| economic contraction | A decrease in an economy's capacity to produce goods and services, typically represented by an inward shift of the PPC. |
| economic growth | An increase in the production of goods and services in an economy over time, measured by the growth rate of real GDP per capita. |
| efficiency | The production of the maximum output from a given set of resources, represented by points on the PPC. |
| factors of production | The resources used to produce goods and services, including land, labor, capital, and entrepreneurship. |
| increasing opportunity costs | A situation where the opportunity cost of producing one good increases as more of that good is produced, resulting in a bowed-out PPC. |
| inefficiency | A situation where resources are not being used optimally, resulting in production below the maximum possible output. |
| opportunity cost | The value of the next best alternative that must be given up when making a choice. |
| Production Possibilities Curve | A graph showing the maximum combinations of two goods that can be produced with available resources and technology. |
| productivity | The amount of output produced per unit of input, such as output per worker or output per hour of labor. |
| scarcity | The fundamental economic problem that resources are limited while wants and needs are unlimited. |
| technology | Tools, techniques, and knowledge used in production that improve efficiency and output. |
| trade-offs | The choices made when selecting one option over another due to limited resources and competing wants. |
| underutilized resources | Resources that are not being used to their full productive capacity, represented by points inside the PPC. |
Frequently Asked Questions
What are the three basic economic questions that every society has to answer?
Every society must answer three basic questions about scarce resources: 1) What goods and services should be produced? 2) How should those goods and services be produced (which combination of labor, capital, technology)? 3) Who gets/consumes the output (how is it distributed)? How those questions get answered depends on the economic system: command economies use central planning, market economies use the price mechanism and private property rights, and mixed economies combine market signals with government intervention (think public goods, externalities). These choices drive trade-offs shown on the PPC and involve opportunity cost—core CED concepts (EK MKT-1.B.1, EK MKT-1.B.2). This is a Unit 1 foundational idea (Unit 1 = 5–10% of the AP exam), so be comfortable explaining systems and using terms like price mechanism, central planning, and production possibilities frontier. For a quick review, see the Topic 1.2/PPF study guide (https://library.fiveable.me/ap-macroeconomics/unit-1/opportunity-cost-production-possibilities-curve-ppc/study-guide/tYxd5oXO5LDRLYfUOR69) and try practice problems (https://library.fiveable.me/practice/ap-macroeconomics).
How does a command economy decide what to produce compared to a market economy?
A command economy answers the three basic questions (what, how, who) through central planning: a government agency sets production targets, allocates resources, and assigns output to consumers. Planners use quotas and priorities (e.g., heavy industry or food) instead of prices, so incentives like profit and private property play a minimal role. A market economy answers those same questions through the price mechanism: prices change with supply and demand, guiding firms (seeking profit) and households (responding to prices) to allocate scarce resources. In short—command = allocation by central plan and government directives; market = allocation by decentralized price signals, private property rights, and profit incentives. Mixed economies combine both. This distinction is exactly what Topic 1.2 (EK MKT-1.B.1 & .2) expects you to know; review the unit study guide (https://library.fiveable.me/ap-macroeconomics/unit-1/opportunity-cost-production-possibilities-curve-ppc/study-guide/tYxd5oXO5LDRLYfUOR69) and try practice problems (https://library.fiveable.me/practice/ap-macroeconomics) to reinforce it.
I'm confused about the difference between market economy and mixed economy - can someone explain?
Market economy: private individuals and firms make the three allocation decisions—what, how, and who—mainly through the price mechanism. Private property rights, competition, and supply/demand determine production and distribution. Markets respond to price signals; profits and losses guide resources to their highest-valued uses. Market economies rely less on government planning and more on decentralized decisions. Mixed economy: combines market signals with government intervention. Private markets still allocate most resources, but the government steps in to correct market failures (public goods, externalities), provide redistribution, regulate, or supply goods/services the market underprovides. So you still have prices and private property, but with taxes, subsidies, regulation, and public provision balancing outcomes. On the AP exam, know that resource allocation answers the three basic questions and that the system (command, market, mixed) changes the coordinating mechanism (price vs. planning vs. combination)—this is EK MKT-1.B.1 and EK MKT-1.B.2. For quick review, see the Unit 1 study guide (https://library.fiveable.me/ap-macroeconomics/unit-1/opportunity-cost-production-possibilities-curve-ppc/study-guide/tYxd5oXO5LDRLYfUOR69) and more Unit 1 material (https://library.fiveable.me/ap-macroeconomics/unit-1). Practice questions are at (https://library.fiveable.me/practice/ap-macroeconomics).
What is resource allocation and why does it matter for AP Econ?
Resource allocation is how a society decides what to produce, how to produce it, and who gets the output—the three basic questions from the CED (EK MKT-1.B.1). It matters because all resources are scarce, so choices involve opportunity costs and trade-offs (see PPC and opportunity cost). The economic system (command, market, or mixed) sets the coordinating mechanism: central planning vs. price signals, private property rights, and government intervention (EK MKT-1.B.2). For AP Macro, you’ll need to explain these concepts, draw/explain PPCs, and connect allocation to market failures (externalities, public goods) and factor markets—skills that show up on Unit 1 multiple-choice and free-response (graphing is assessed on FRQs). Review the Topic 1.2 ideas and PPC practice in the Unit 1 study guide (https://library.fiveable.me/ap-macroeconomics/unit-1/opportunity-cost-production-possibilities-curve-ppc/study-guide/tYxd5oXO5LDRLYfUOR69), the unit overview (https://library.fiveable.me/ap-macroeconomics/unit-1), and try lots of practice questions (https://library.fiveable.me/practice/ap-macroeconomics).
How do institutional arrangements affect how resources get distributed in different economic systems?
Institutional arrangements—who owns resources, who makes rules, and how decisions get coordinated—shape answers to the three allocation questions: what, how, and who. In a market economy private property rights and the price mechanism let decentralized buyers and sellers decide what to produce (profit signals), how to produce (cost-minimizing firms), and who consumes (ability to pay). In a command economy central planning and public ownership let the state choose outputs, production methods, and distribution (administrative directives). Mixed economies combine markets with government intervention to correct market failures (public goods, externalities) and redistribute income. Institutional features like property rights, legal systems, and regulatory agencies also affect factor markets, incentives, and efficiency—shifting the production possibilities frontier over time. For exam prep, tie answers to the CED basics (EK MKT-1.B.1–1.B.2). For a quick refresher, check the Topic 1.2/1.1 study guide (https://library.fiveable.me/ap-macroeconomics/unit-1/opportunity-cost-production-possibilities-curve-ppc/study-guide/tYxd5oXO5LDRLYfUOR69), the unit overview (https://library.fiveable.me/ap-macroeconomics/unit-1), and practice questions (https://library.fiveable.me/practice/ap-macroeconomics).
I don't understand how scarcity relates to the three basic economic questions - help?
Scarcity is the reason the three basic economic questions exist. Because resources are limited, societies must decide (1) what to produce (which goods and services), (2) how to produce them (which combination of labor, capital, technology), and (3) who gets them (distribution). Those choices force trade-offs and opportunity costs—shown by a production possibilities curve (PPC). Different economic systems answer the questions differently: markets use price signals and private property to let supply and demand allocate scarce resources; command systems use central planning; mixed systems combine both (CED EK MKT-1.B.1 & EK MKT-1.B.2). On the AP exam you should be able to connect scarcity → opportunity cost → PPC shifts/points and name the coordinating mechanism (price mechanism vs. central planning). Review the PPC/opportunity-cost guide for diagrams and exam-style problems (https://library.fiveable.me/ap-macroeconomics/unit-1/opportunity-cost-production-possibilities-curve-ppc/study-guide/tYxd5oXO5LDRLYfUOR69). For a quick unit refresher and lots of practice Qs see the unit page (https://library.fiveable.me/ap-macroeconomics/unit-1) and practice bank (https://library.fiveable.me/practice/ap-macroeconomics).
What's the coordinating mechanism in a market economy vs command economy?
In a market economy the coordinating mechanism is the price system (price mechanism): private property, voluntary exchange, and prices guide what, how, and for whom to produce. Prices send signals to buyers and sellers—higher prices ration scarce goods and incentivize more production; lower prices do the opposite. In a command economy the coordinating mechanism is central planning: government planners allocate resources, set output targets, and decide who gets goods, often ignoring price signals. The CED calls these institutional arrangements that shape resource allocation (EK MKT-1.B.2, EK MKT-1.B.1). For AP exam purposes, be ready to compare price signals, private property rights, and efficiency trade-offs versus government control, plus where mixed systems intervene (market failures, externalities). Review this topic’s study guide (https://library.fiveable.me/ap-macroeconomics/unit-1/opportunity-cost-production-possibilities-curve-ppc/study-guide/tYxd5oXO5LDRLYfUOR69) and practice questions (https://library.fiveable.me/practice/ap-macroeconomics).
Can you give me real world examples of command, market, and mixed economies today?
Command economy—North Korea and (to a lesser extent) Cuba: the government centrally plans what to produce, how, and who gets it; allocation is by central planning, not price signals. Historically the USSR was a command system. Market (market-oriented) economy—United States, Singapore, Australia: private property rights and the price mechanism coordinate resource allocation; firms and consumers decide what/how/who, with minimal government direction (note: none are purely market in practice). Mixed economy—France, Sweden, and most modern countries (including the U.S. in practice): markets allocate most resources but the government intervenes to correct market failures, provide public goods, regulate externalities, and redistribute income. For the AP exam, be ready to tie each system to the three allocation questions (what/how/who), coordinating mechanisms (central planning vs. price signals), and issues like market failure and government intervention. For review, see the Topic 1.2 study guide and Unit 1 overview (https://library.fiveable.me/ap-macroeconomics/unit-1/opportunity-cost-production-possibilities-curve-ppc/study-guide/tYxd5oXO5LDRLYfUOR69) and practice problems (https://library.fiveable.me/practice/ap-macroeconomics).
How do trade-offs work when societies are deciding what goods and services to produce?
When a society decides what to produce it faces trade-offs because resources are scarce—choosing more of one good means less of another. The CED frames this as the three basic questions: what, how, and who (EK MKT-1.B.1). Use the production possibilities curve (PPC) and opportunity cost to show the trade-off: any movement along the PPC increases output of one good but decreases the other; the slope equals the opportunity cost. How those trade-offs get resolved depends on the economic system: markets use price signals and private property to allocate resources, command systems use central planning, and mixed systems combine both (EK MKT-1.B.2). On the AP exam you may need to draw/interpret a PPC or explain opportunity cost (Skill 4.A/4.B). For a quick refresher see the unit 1 PPC study guide (https://library.fiveable.me/ap-macroeconomics/unit-1/opportunity-cost-production-possibilities-curve-ppc/study-guide/tYxd5oXO5LDRLYfUOR69) and try practice problems (https://library.fiveable.me/practice/ap-macroeconomics).
What does it mean that resource allocation involves constraints?
Saying resource allocation “involves constraints” means choices are limited because resources are scarce—you can’t produce everything. Scarcity forces trade-offs: using resources for one good means you give up producing another (opportunity cost). That’s why economists ask the three allocation questions: what to produce, how to produce it, and who gets it (EK MKT-1.B.1). Constraints show up on a production possibilities curve (PPC): points inside are attainable but inefficient, points on the curve use resources fully, and points outside are unattainable given current resources and technology. Different economic systems (command, market, mixed) use different mechanisms—central planning, price signals, or a mix—to allocate those constrained resources (EK MKT-1.B.2). For a clear PPC review, see the Topic 1.2 study guide (https://library.fiveable.me/ap-macroeconomics/unit-1/opportunity-cost-production-possibilities-curve-ppc/study-guide/tYxd5oXO5LDRLYfUOR69). Need practice? Try problems at (https://library.fiveable.me/practice/ap-macroeconomics).
Why do different economic systems answer "who consumes goods and services" differently?
Who consumes goods and services depends on the system’s allocation mechanism and incentives. In a market economy, consumption is determined by price signals and purchasing power: people who can pay market prices (income from factor markets, private property rights) buy goods, so income distribution and willingness to pay decide who consumes. In a command economy, central planners allocate output to people or groups based on government priorities, so consumption follows bureaucratic decisions rather than prices. Mixed economies combine both: markets allocate most goods, but government intervention (redistribution, public goods, transfers) changes who gets what. These differences matter because they change trade-offs (opportunity cost), equity vs. efficiency, and how shortages or externalities are handled—exactly what Topic 1.2 covers in the CED. For a quick review on allocation and the PPC, see the Unit 1 study guide (https://library.fiveable.me/ap-macroeconomics/unit-1/opportunity-cost-production-possibilities-curve-ppc/study-guide/tYxd5oXO5LDRLYfUOR69). Practice more with problems at (https://library.fiveable.me/practice/ap-macroeconomics).
I'm studying for the AP test - what are the key differences between all three economic systems?
Three quick differences you should memorize for the exam: - Command economy: The government answers what, how, and who—central planning decides production and distribution. Private property and price signals play little role, so allocation can ignore consumer preferences and suffer inefficiencies (shortages, surpluses). Think: allocation by bureaucratic instructions, not prices. - Market economy: Private firms and households decide what, how, and who via markets and the price mechanism. Private property rights, competition, and factor markets drive allocation. Prices coordinate scarce resources, but markets can fail (externalities, public goods), so outcomes aren’t always socially optimal. - Mixed economy: Combines both—markets and price signals allocate most resources but government intervenes to correct market failures, provide public goods, redistribute income, or regulate. Most modern economies are mixed. For AP prep, link these to PPCs, opportunity cost, and factor markets (Unit 1). Review Topic 1.2 in this study guide (https://library.fiveable.me/ap-macroeconomics/unit-1/opportunity-cost-production-possibilities-curve-ppc/study-guide/tYxd5oXO5LDRLYfUOR69), the Unit 1 overview (https://library.fiveable.me/ap-macroeconomics/unit-1), and practice questions (https://library.fiveable.me/practice/ap-macroeconomics).
How does scarcity force societies to make choices about resource allocation?
Scarcity means resources (land, labor, capital, entrepreneurship) are limited, so societies must make choices about allocation—which goods to produce, how to produce them, and who gets them (CED EK MKT-1.B.1). Those choices create trade-offs and opportunity costs you can show on a PPC: producing more of one good means less of another. The economic system determines the coordinating mechanism: markets use price signals and private property rights to allocate scarce resources; command systems use central planning; mixed systems combine both (EK MKT-1.B.2). For the AP exam, be ready to explain choices with opportunity cost and illustrate them on a PPC and relate system features (price mechanism, central planning, government intervention) to allocation outcomes. For a clear PPC review and practice problems, see the Topic 1.1/1.2 study guide (https://library.fiveable.me/ap-macroeconomics/unit-1/opportunity-cost-production-possibilities-curve-ppc/study-guide/tYxd5oXO5LDRLYfUOR69) and more unit resources (https://library.fiveable.me/ap-macroeconomics/unit-1).
What role do institutions play in determining how an economy allocates resources?
Institutions—like property rights, the legal system, firms, markets, banks, and government agencies—shape how an economy answers the three basic questions: what, how, and who (EK MKT-1.B.1). In a market system, private property and competitive markets use price signals (the price mechanism) to allocate resources; firms and households respond to prices, so supply and demand determine what’s produced, how efficiently it’s produced, and who gets goods. In a command system, central planning institutions set production and distribution directly. Most real economies are mixed: institutions (regulations, taxes, subsidies, public-provision agencies) correct market failures (public goods, externalities) and redistribute output. For the AP exam, be ready to link specific institutions to coordinating mechanisms (price mechanism vs. central planning) and to explain trade-offs on the PPC (opportunity cost). For a quick refresher, see the Unit 1 study guide (https://library.fiveable.me/ap-macroeconomics/unit-1/opportunity-cost-production-possibilities-curve-ppc/study-guide/tYxd5oXO5LDRLYfUOR69) and more unit review (https://library.fiveable.me/ap-macroeconomics/unit-1). Practice questions are at (https://library.fiveable.me/practice/ap-macroeconomics).
Is the US economy really a mixed economy or more of a market economy?
Short answer: the U.S. is a mixed economy with strong market features. Prices, private property, and voluntary exchange (the price mechanism) do most resource allocation work, so it behaves largely like a market economy. But the government steps in when markets fail—providing public goods, regulating externalities, enforcing property rights, running safety-net programs, and using fiscal/monetary policy—so it’s not a “pure” market system. For AP Macro, you should link this to Topic 1.2 ideas: who answers the three allocation questions (private firms/consumers via price signals vs. government via laws/policy) and when intervention is justified (market failure, public goods, redistribution). Review the CED keywords (price mechanism, government intervention, market failure) and the Topic 1.2 study guide on Fiveable (https://library.fiveable.me/ap-macroeconomics/unit-1/opportunity-cost-production-possibilities-curve-ppc/study-guide/tYxd5oXO5LDRLYfUOR69). For extra practice, use the unit page and 1,000+ practice problems (https://library.fiveable.me/ap-macroeconomics/unit-1 and https://library.fiveable.me/practice/ap-macroeconomics).