🤑AP Microeconomics Unit 2 Review
2.1 Demand
2.1 Demand
Unit & Topic Study Guides
Unit 1 – Basic Economic Concepts
Unit 2 – Supply and Demand
Unit 3 – Production, Cost, and the Perfect Competition Model
Unit 4 – Imperfect Competition
Unit 5 – Factor Markets
Unit 6 – Market Failure and the Role of Government
AP Microeconomics Exam
Big Ideas
Demand is the relationship between the price of a good and the quantity buyers are willing and able to purchase, and the law of demand says those two move in opposite directions. A change in a good's own price moves you along the demand curve, while a change in any other determinant (income, related goods prices, expectations, number of buyers, or tastes) shifts the whole curve left or right.
Why This Matters for the AP Microeconomics Exam
Demand is the entry point for the supply and demand model, which anchors all of Unit 2 and shows up across the AP Microeconomics exam. If you can read a demand curve, tell the difference between a movement and a shift, and explain why the curve slopes downward, you have the tools you need for market equilibrium, elasticity, surplus, and government intervention later.
This topic rewards clear graphing and precise cause-and-effect reasoning. On multiple-choice questions you will identify what happens to demand when a determinant changes. On free-response questions you may need to draw a correctly labeled demand curve and explain a shift, so labeling axes and curves accurately matters for earning points.

Key Takeaways
- Demand links price to the quantity buyers are willing and able to buy; the law of demand makes that relationship inverse.
- The demand curve slopes downward because of the substitution effect, the income effect, and/or diminishing marginal utility.
- A change in the good's own price is a movement along the curve (a change in quantity demanded), not a shift.
- A change in a determinant shifts the whole curve: right for an increase in demand, left for a decrease.
- Use the I-N-S-E-C-T determinants to track what shifts demand: Income, Number of consumers, Substitutes, Expectations, Complements, and Tastes.
- Market demand comes from adding up individual demand curves at each price (horizontal summation).
What Is Demand?
A market brings together producers who supply goods and consumers who demand them. Demand is the relationship between the price of a good and the quantity that consumers are willing and able to buy. Both parts matter: wanting something is not enough, you also need the ability to pay for it.
Buyers respond to incentives like price, but they also face constraints such as income, time, and legal or regulatory rules (taxes, subsidies, or bans). A well-defined system of property rights is what lets the market system function well in the first place.
The Law of Demand
The law of demand says that as the price of a good rises, the quantity demanded falls, and as the price drops, the quantity demanded rises, holding everything else constant. If chocolate bars cost $0.50 you might buy 10, but at $2.00 you might buy only 3.
Three ideas explain why this happens:
- Substitution effect: When a good's price rises, consumers switch toward cheaper substitutes. When chocolate gets more expensive, you might buy mints instead. When the price falls, the good becomes more appealing relative to its substitutes, so you buy more of it.
- Income effect: A higher price lowers your purchasing power, so the same income buys less, and you tend to buy less of that good. A lower price raises purchasing power, so you can buy more.
- Diminishing marginal utility: The extra satisfaction from each additional unit of a good falls as you consume more of it. The first slice of pizza gives more satisfaction than the fourth. Because added units are worth less to you, you only buy more when the price is lower.
These effects are why the demand curve slopes downward.
Graphing Demand
On a demand graph, quantity goes on the x-axis and price goes on the y-axis. This is one of the most common axis setups in AP Microeconomics, so get comfortable with it early.
Note: You might wonder why quantity sits on the x-axis when price drives it. Economists put quantity there by convention, and it has historical roots. It feels odd at first but becomes second nature with practice.
Because lower prices mean higher quantity demanded, the demand curve is downward sloping. You can draw it as a straight line or a curve as long as it slopes down.
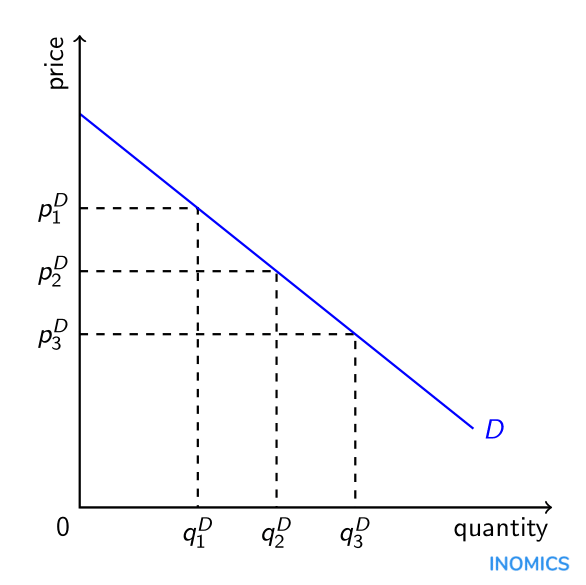
At P1, the quantity demanded is Q1. When price falls, quantity demanded rises to Q2. That is the law of demand in action.
You can also think of the demand curve as a marginal benefit curve: each point shows the most a buyer is willing to pay for one more unit, which reflects the benefit they expect from it.
Demand vs. Quantity Demanded
These two terms sound the same but are not.
Demand is the entire relationship between price and how much consumers will buy across all prices. It is the whole curve.
Quantity demanded is the specific amount consumers will buy at one particular price. It is a single point on the curve.
This distinction matters for shifts. A change in the good's own price does not move the whole curve, it just moves you along the curve to a different point (a change in quantity demanded). Anything else that changes buying behavior shifts the entire curve.
Shifting Demand
When something outside the good's own price changes, the quantity demanded changes at every price point. That shows up as the whole curve moving: right for an increase in demand, left for a decrease. These outside factors are called the determinants of demand, and you can remember them with the acronym I-N-S-E-C-T.
Income: When income rises, demand for normal goods increases as people spend more. For inferior goods, higher income can lower demand as buyers switch to better options. Falling income reverses these effects.
Number of consumers: More buyers in the market increase demand; fewer buyers decrease it.
Substitutes: If the price of a substitute changes, demand for this good changes. When a substitute gets more expensive, buyers shift toward this good, raising its demand.
Expectations: If buyers expect prices or income to rise in the future, they may buy more now, increasing current demand. Expecting prices to fall can lower current demand.
Complements: Goods used together affect each other. If demand for cars rises, demand for tires rises too, since they are used together. A price change in one complement shifts demand for the other.
Tastes: When a good becomes more popular or fashionable, demand increases. When it falls out of favor, demand decreases.
Quick recap on direction:
- An increase in demand shifts the curve right: at every price, quantity demanded is higher.
- A decrease in demand shifts the curve left: at every price, quantity demanded is lower.

Market Demand
The market demand curve comes from adding up all the individual demand curves in the market. At each price, you sum the quantities every buyer wants, which is called horizontal summation. Because each individual curve slopes downward, the market demand curve does too.
How to Use This on the AP Microeconomics Exam
MCQ
- Decide first whether the change is the good's own price (movement along the curve) or something else (shift). This is the most common trap.
- Match each scenario to an I-N-S-E-C-T determinant and state the shift direction.
- Watch for substitutes and complements: a price change in a related good shifts the demand for the good in question, not its own curve.
Free Response
- Draw a correctly labeled graph: axes labeled price and quantity, and the demand curve labeled clearly.
- Show a shift with a new labeled curve (for example, D1 to D2) and an arrow or clear direction, not just words.
- When you explain a shift, name the determinant and the direction, then connect it to the change in quantity demanded at every price.
Common Trap
- Saying demand "increased" when only quantity demanded changed because of a price change. Use the right term for the right situation.
Common Misconceptions
- "A change in price shifts the demand curve." A change in the good's own price is a movement along the curve, not a shift. Only the non-price determinants shift it.
- "Demand and quantity demanded mean the same thing." Demand is the whole curve; quantity demanded is one point on it at a specific price.
- "Higher income always increases demand." That is true for normal goods, but for inferior goods higher income lowers demand.
- "A substitute getting cheaper raises demand for this good." It does the opposite: a cheaper substitute pulls buyers away, lowering demand for this good.
- "The downward slope is just a rule." It comes from real reasons: the substitution effect, the income effect, and diminishing marginal utility.
- "Any line that goes down works as a demand curve." It must be strictly downward sloping, and on the AP exam your axes and curves must be labeled to earn points.
Related AP Microeconomics Guides
Vocabulary
The following words are mentioned explicitly in the AP® course framework for this topic.Term | Definition |
|---|---|
constraints | Limitations that restrict economic agents' choices, such as income, time, legal frameworks, or regulatory requirements. |
demand curve | A graph showing the relationship between the price of a good and the quantity demanded at each price level, typically downward-sloping. |
demand curve shift | A change in the entire demand curve caused by changes in determinants of demand other than the good's own-price. |
demand schedule | A table showing the quantities of a good demanded at different price levels. |
determinants of consumer demand | Factors other than price that influence the quantity of a good consumers are willing to buy, causing shifts in the demand curve. |
diminishing marginal utility | The principle that as a consumer consumes more of a good, the additional satisfaction gained from each additional unit decreases. |
incentives | Factors that motivate economic actors to make particular choices or take specific actions. |
income effect | The change in quantity demanded resulting from a change in a consumer's purchasing power due to a price change. |
law of demand | An economic principle stating that as the price of a good increases, the quantity demanded decreases, and vice versa, assuming all other factors remain constant. |
marginal benefits | The additional benefit or satisfaction gained from consuming or producing one more unit of a good. |
market demand curve | The aggregate demand curve derived by summing all individual consumers' demand curves at each price level. |
property rights | Legal entitlements that specify who owns a resource and what they can do with it; well-defined property rights help internalize externalities. |
quantity demanded | The amount of a good or service that consumers are willing and able to purchase at a given price. |
substitution effect | The change in quantity demanded resulting from a consumer switching to relatively cheaper alternatives when a good's price increases. |
Frequently Asked Questions
What is demand in AP Microeconomics?
Demand is the relationship between the price of a good and the quantity buyers are willing and able to purchase. It is shown by the entire demand curve, not just one point on the graph.
What is the law of demand?
The law of demand says that when a good’s own price rises, quantity demanded falls, and when its price falls, quantity demanded rises, holding other factors constant. This creates a movement along the demand curve.
What is the substitution effect in AP Micro?
The substitution effect means buyers switch toward cheaper substitutes when a good becomes more expensive. It helps explain why the demand curve slopes downward.
What is the income effect in microeconomics?
The income effect means a price change affects purchasing power. When a price rises, the same income buys less, so buyers tend to purchase less of that good; when price falls, purchasing power rises.
What shifts the demand curve?
Non-price determinants shift demand, including income, number of consumers, prices of substitutes and complements, expectations, and tastes. A change in the good’s own price moves along the curve instead of shifting it.
How should I draw demand on AP Micro FRQs?
Put price on the vertical axis and quantity on the horizontal axis, draw a downward-sloping curve, and label it clearly. If demand shifts, draw a new curve and explain the determinant that caused the shift.