Some of this section gets a little advanced. If you don't know calculus or get confused with some of the more complex math used in this study guide, don't worry! Outside of the stuff you learned in the last section about rate laws, you don't need to know how to derive anything, just know how to apply the formulas for rate laws and integrated rate laws and understand in a basic sense how they work! We've bolded the important stuff to know for the AP Exam.
The Math Behind the Rate Law
As mentioned before, the reaction order is described by the variable n. This notation is used because n typically describes an integer value in science and mathematics, and the order of a reaction is typically an integer, however, it does not have to be an integer.
One such example is Michaelis–Menten kinetics, which is one of the most commonly known kinetic models in biochemistry. The specific details are not important, however, for biology aficionados, the general reaction that these kinetics describe is:

In this case, E is an enzyme (a specific category of a catalyst, which will be studied further in this unit), S is a substrate, and P is a general product. These reactions typically have a fractional reaction order in certain cases. Notice that the enzyme is regenerated by the reaction as if it were never consumed by the reaction in the first place.
Though, typical chemical reactions retain integer values for their reaction order. For the purposes of the AP exam, we will only discuss the n = 0, n = 1, and n = 2 cases in-depth. However, for those proficient in calculus, we will solve the problem for the general case (such that n ≠ 1).
As mentioned before, the order describes how the amount of molecules present, aka concentration, affects the reaction rate. In order to investigate this further, we must motivate the idea of a concept called a rate law. To make the mathematics intuitive, let's imagine the idea of population dynamics. For a population in a crisis, the population as a function of time is modeled as decaying exponentially:

In this case, P0 is the initial population, t is time, and t1/2 is the half-life of the population, which is how long it takes for a population to reach half its initial population.
For reasons motivated by calculus, we express the base of the exponential as the number e:

This equation should be somewhat intuitive. In the case of the crisis being a disease, as more people die, the number of disease carriers decreases, which means fewer and fewer people can be affected as time goes on, leading to both a decrease in population along with a decrease in how fast the population is decaying (Fig. 1).
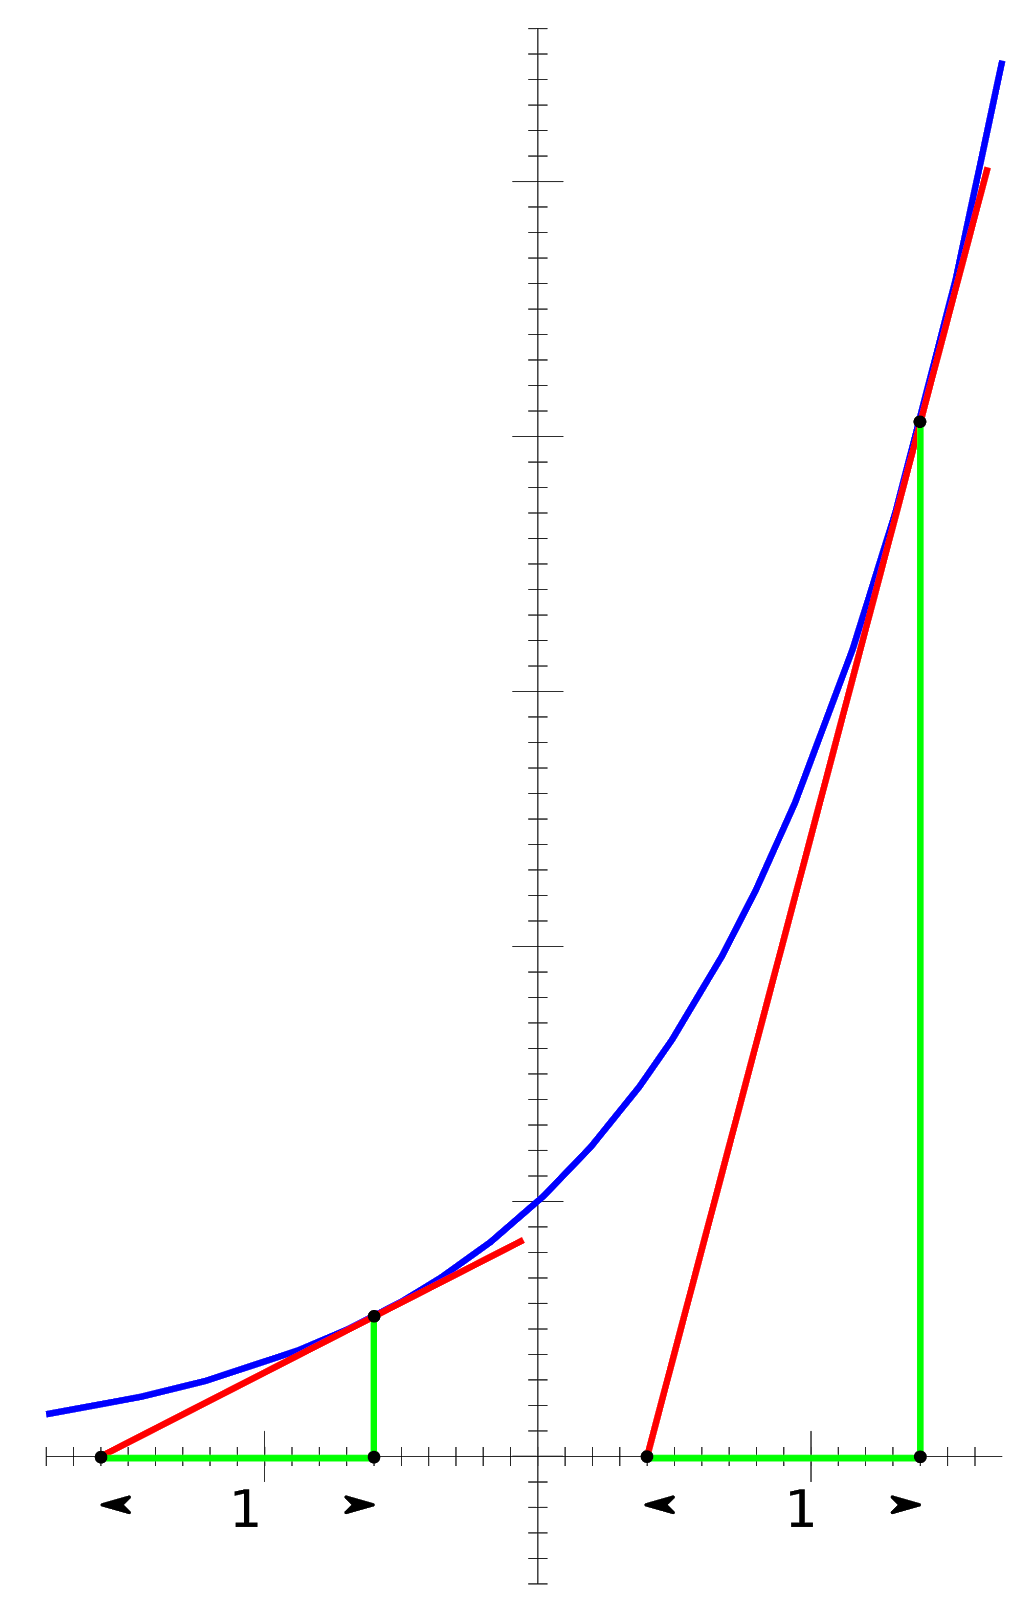

In the above figure, the slopes of the red tangent lines represent the instantaneous rates of change. One can see that, as the graph itself increases in value, so does the rate of change of the graph. This concept is easily reversed to represent population decay, as population decay is exponential decay instead of exponential growth.
A very important property of exponential functions is that the rate of change of an exponential function is proportional to itself:
.png?alt=media&token=9a2b7b26-2c70-4c11-bed2-e4ce85de6205)
While slightly morbid and dark, this same concept can be applied to chemical reactions. As the reaction progresses, fewer and fewer atoms are able to react with one another, so there are analogously fewer disease carriers to spread the aforementioned fatal disease.
Connecting to Chemistry
Connecting this concept to chemistry, let's consider the simple reaction A → B. We model the rate of the reaction as the rate of the formation of B, which is also the same as the rate of the depletion of A. As previously established, this relationship is shaped like an exponential decay curve, thus we can logically arrive at the following equation: Rate = k[A]. However, this is only true for the n = 1 case. For any n: Rate = k[A]^n. This is simply called a rate law of order n with rate constant k.
If we invoke calculus notation for rates of change, those proficient in calculus will recognize the equation as a separable differential equation:

If you, the reader, do not know calculus and/or are not comfortable with the technique of separation of variables, don't worry, as it is not necessary for the AP exam. Feel free to skip to the end of this section to the next bold text if you don't want to see the derivation of the integrated rate laws. However, for those that are comfortable with the technique, we can solve for the concentration of A as a function of time:
.png?alt=media&token=c9820e01-4a3d-49b3-9bd9-b11e8f8241ec)
.png?alt=media&token=865805f3-3d05-4837-81a9-c00f28363599)
To solve for the constant of integration C, we will use the notational condition that A = [A]o, which is simply the concentration before the reaction proceeds.
.png?alt=media&token=9be5c4c3-645e-4f14-a50f-60edb17263b7)
Because of the condition set by Eq. 25 (n ≠ 1), we will analyze the above equation for the n = 2 case:
.png?alt=media&token=f12c21af-8a1d-4df5-9c42-9cb21f4ab0c1)
We can divide both equations by a factor of -1 and use properties of powers to come up with the following equation:
.png?alt=media&token=a6ae3329-8e95-492a-9dd8-6e7321a6a552)
Eq. 29 is the same equation as the one on the official AP formula sheet and is known as the second-order integrated rate law, where [A] is the final concentration, [A]₀ is the initial concentration, k is the rate constant, and t is the elapsed time. The first-order integrated rate law is ln([A]) - ln([A]₀) = -kt. These equations can be used to calculate the rate law, based on reaction order and the rate constant (which is temperature dependent).
Integrated Rate Laws
An important concept is that these equations can be put onto a graph to produce a linear relationship. From an established linear relationship, we can solve for the rate constant k.
A linear relationship between two variables y and x is defined by a familiar equation from algebra:
.png?alt=media&token=72a699cc-a902-4e08-9d99-e04be32a00db)
Complete Set of Integrated Rate Laws
Let's look at all three integrated rate laws that you need to know for the AP exam:
Zeroth-order: [A]t - [A]₀ = -kt
- This tells us that concentration decreases linearly with time at a constant rate
Understanding Zeroth-Order Reactions
Zeroth-order reactions are unique because their rate is independent of the concentration of reactants. This means Rate = k (not Rate = k[A]⁰, since [A]⁰ = 1). These reactions occur when:
- The reaction is limited by something other than reactant concentration
- Surface-catalyzed reactions where the catalyst surface is saturated
- Enzyme-catalyzed reactions at high substrate concentrations
- Photochemical reactions where light intensity is the limiting factor
Key characteristics of zeroth-order reactions:
- Constant reaction rate: The amount of reactant consumed per unit time is constant
- Linear concentration decay: A plot of [A] vs. time gives a straight line with slope = -k
- Half-life depends on initial concentration: t₁/₂ = [A]₀/(2k)
- Units of k: M/s (or mol·L⁻¹·s⁻¹)
Example: The decomposition of ammonia on a hot platinum surface at high pressures follows zeroth-order kinetics because the platinum surface becomes saturated with NH₃ molecules.
First-order: ln([A]) - ln([A]₀) = -kt
- This can also be written as ln([A]₀/[A]) = kt
Second-order: 1/[A] - 1/[A]₀ = kt
- Concentration decreases more rapidly at first, then more slowly
Analyzing the integrated rate law for n = 0,:

for n =1,:
.png?alt=media&token=f9697394-dd7a-428a-aff5-fdc888ad7c24)
and for n = 2:
.png?alt=media&token=645ddd9a-5069-4360-8ed1-88c3e072010a)
Determining Reaction Order from Graphs
The order of a reaction can be inferred from a graph of concentration of reactant versus time. This is a fundamental principle in chemical kinetics that allows us to determine reaction order from experimental data without knowing the rate law beforehand.
Here's the key insight for determining reaction order:
To determine the order of a reaction from concentration vs. time data, plot different functions of concentration against time and see which gives a straight line:
- If a plot of [A] vs. time gives a straight line → Zeroth-order reaction
- The concentration decreases at a constant rate
- The slope equals -k
- If a plot of ln[A] vs. time gives a straight line → First-order reaction
- The concentration decreases exponentially
- The slope equals -k
- If a plot of 1/[A] vs. time gives a straight line → Second-order reaction
- The concentration decreases rapidly at first, then more slowly
- The slope equals k (positive!)
Important: The slopes of the concentration versus time data for zeroth, first, and second order reactions can be used to determine the rate constant for the reaction. This is a crucial experimental technique - by plotting the appropriate function and finding the slope of the resulting straight line, you can calculate k directly from experimental data.
This will likely be information that is necessary to determine the order of a reaction, which has come up on free-response questions several times!
Example Question
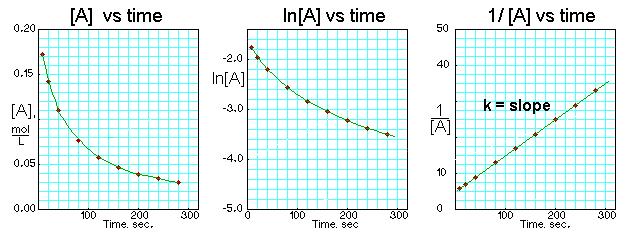
For the reaction A → B, the following graphs are shown:
a) What is the rate law for the reaction? Represent the rate constant as k, not a numerical value. Explain how you arrived at your answer
b) Estimate the value of k for this reaction. Show all work.
c) If the initial concentration of A is 0.200 M, what is the concentration remaining after 30 seconds?
Answers
a) We see that the reaction is linear on the rightmost graph, which is 1/[A] vs time, meaning that the reaction is second order in A, making the rate law R = k[A]² (+1 for the answer, +1 for explanation with linear relationship).
b) The points (0, 5) and (200, 25) can be seen on the graph, meaning k = 25 - 5/200-0 = 20/200 = 0.1 Lm⁻¹s⁻¹ (+1 for setting up a slope equation, +1 for correct answer with correct units)
c) We can use the second-order integrated rate law:
1/[A] - 1/[A]0 = kt
1/[A] - 1/0.200 = 0.1(30)
1/[A] = 0.1(30) + 1/0.200 = 8
[A] = 0.125M (+1 for setup, +1 for answer with units)
Half-Life in First-Order Reactions
Half-life is defined as the time it takes for the concentration of a substance to decrease by half. This concept goes into nuclear chemistry, which is not included in the AP Chemistry curriculum but is important in first-order reactions.
Half-life is related to the rate constant (k) of a first-order reaction by the equation: t1/2 = 0.693/k. This equation can be used to determine the half-life of a substance if the rate constant for the reaction is known, or to determine the rate constant if the half-life is known. The most important thing to note is that for a first-order reaction, the half-life is constant.
The equation for the half-life of a first-order reaction (t1/2 = 0.693/k) is on the reference table given to you on the AP Chemistry exam!
Radioactive Decay: A Perfect Example of First-Order Kinetics
Radioactive decay processes provide an important illustration of first-order kinetics. When unstable nuclei decay, the rate of decay depends only on the number of radioactive nuclei present - it follows first-order kinetics perfectly!
Key features of radioactive decay:
- The decay rate is proportional to the amount of radioactive material: Rate = k[N]
- Each radioactive isotope has a characteristic half-life that never changes
- The half-life is independent of the amount of material present
- Common examples include:
- Carbon-14 (t₁/₂ = 5,730 years) - used in carbon dating
- Uranium-238 (t₁/₂ = 4.5 billion years)
- Iodine-131 (t₁/₂ = 8 days) - used in medical treatments
The constant half-life of radioactive isotopes makes them incredibly useful for dating archaeological artifacts, geological samples, and in medical applications. This is why first-order kinetics is so important beyond just chemical reactions!
Vocabulary
The following words are mentioned explicitly in the College Board Course and Exam Description for this topic.Term | Definition |
|---|---|
first order reaction | A reaction whose rate depends on the concentration of one reactant raised to the first power; characterized by a linear plot of ln[A] versus time. |
half-life | The time required for the concentration of a reactant to decrease to half its initial value; for first order reactions, the half-life is constant and independent of initial concentration. |
radioactive decay | The spontaneous process by which unstable atomic nuclei emit radiation and transform into more stable forms; follows first order kinetics. |
rate constant | The proportionality constant in a rate law expression that relates reaction rate to reactant concentrations; its value depends on temperature. |
rate law | A mathematical expression that relates the reaction rate to the concentrations of reactants, with each concentration raised to a power (order). |
reaction order | The power to which the concentration of a reactant is raised in the rate law expression; indicates how the reaction rate depends on that reactant's concentration. |
second order reaction | A reaction whose rate depends on the concentration of one reactant raised to the second power, or on the concentrations of two reactants each raised to the first power; characterized by a linear plot of 1/[A] versus time. |
zeroth order reaction | A reaction whose rate is independent of the concentration of reactants; characterized by a linear plot of [A] versus time. |
Frequently Asked Questions
What is reaction order and how do you figure it out from concentration vs time graphs?
Reaction order tells you how the rate depends on concentration of a reactant (zero-, first-, second-order for this topic). To figure it out from concentration vs time data, try the integrated-rate plots from the CED: - Zeroth order: [A] vs time is linear. Slope = -k (so k = -slope). - First order: ln[A] vs time is linear. Slope = -k. Also half-life is constant: t1/2 = 0.693/k (useful for radioactive decay examples). - Second order: 1/[A] vs time is linear. Slope = +k. So take your concentration data, plot [A], ln[A], and 1/[A] vs time. The plot that gives a straight line tells you the order and its slope gives k (matching CED 5.3.A.1–5.3.A.4). For exam free-response, show the linear fit and use the slope to calculate k and (if first order) t1/2. For extra practice, check the Topic 5.3 study guide (https://library.fiveable.me/ap-chemistry/unit-5/concentration-changes-over-time/study-guide/Owtcz3zbxFZXsPI7YfwJ) and thousands of practice problems (https://library.fiveable.me/practice/ap-chemistry).
How do I know if a reaction is zero order, first order, or second order just by looking at data?
Look at how concentration changes with time and make three plots: [A] vs. t, ln[A] vs. t, and 1/[A] vs. t. Whichever plot is most linear tells the order for A: - Zeroth order: [A] vs. t is linear and follows [A]t − [A]0 = −kt (slope = −k). - First order: ln[A] vs. t is linear and follows ln[A]t − ln[A]0 = −kt (slope = −k). Also half-life is constant: t1/2 = 0.693/k. - Second order: 1/[A] vs. t is linear and follows 1/[A]t − 1/[A]0 = kt (slope = k). Use R² (or how straight the line looks) to pick the best fit. If you only have initial-rate data, use the method of initial rates to find the exponent. For practice, check the Topic 5.3 study guide (https://library.fiveable.me/ap-chemistry/unit-5/concentration-changes-over-time/study-guide/Owtcz3zbxFZXsPI7YfwJ) and try problems at Fiveable’s practice page (https://library.fiveable.me/practice/ap-chemistry).
Why do we have to use ln and 1/[A] plots instead of just regular concentration graphs?
Because the integrated rate laws for different reaction orders give different mathematical relationships between [A] and t, you can’t reliably tell order or get k from the raw [A] vs t curve alone. For a first-order reaction ln[A] vs t is linear (ln[A]t − ln[A]0 = −kt) and for a second-order reaction 1/[A] vs t is linear (1/[A]t − 1/[A]0 = kt). Plotting those transformed quantities straightens the curved concentration data so you can (1) identify the order by which plot is linear and (2) get k directly from the slope (CED 5.3.A.2–5.3.A.4). First-order half-life is constant (t1/2 = 0.693/k), which also follows only when you’ve confirmed first order. For a quick refresher and practice on making these plots, see the Topic 5.3 study guide (https://library.fiveable.me/ap-chemistry/unit-5/concentration-changes-over-time/study-guide/Owtcz3zbxFZXsPI7YfwJ) and try more problems at (https://library.fiveable.me/practice/ap-chemistry).
I'm confused about integrated rate laws - what's the difference between all those equations?
Integrated rate laws just rewrite the rate law so concentration vs time is explicit for different reaction orders. Use these forms from the CED to identify order and get k from the slope: - Zeroth order: [A]t = [A]0 − kt → plot [A] vs t; slope = −k. - First order: ln[A]t = ln[A]0 − kt → plot ln[A] vs t; slope = −k. Half-life is constant: t1/2 = 0.693/k (useful on the exam). - Second order: 1/[A]t = 1/[A]0 + kt → plot 1/[A] vs t; slope = +k. Which one to use: try all three linear plots—the one that’s straight tells you the order (CED 5.3.A.1–5.3.A.4). Slopes give k and let you predict concentrations at any t. For reactions that behave like first order because one reactant is in large excess, use a pseudo-first-order approximation (see Topic 5.3 study guide: https://library.fiveable.me/ap-chemistry/unit-5/concentration-changes-over-time/study-guide/Owtcz3zbxFZXsPI7YfwJ). For extra practice, try problems at (https://library.fiveable.me/practice/ap-chemistry).
What does it mean when they say the slope gives you the rate constant?
When they say “the slope gives you the rate constant,” they mean that for the integrated rate-law plot that is linear for a given reaction order, the slope of that straight line equals (±) the numerical value of k. For the common cases in the CED: - Zeroth order: plot [A] vs. t → slope = d[A]/dt = −k (so slope is −k). - First order: plot ln[A] vs. t → slope = −k (so the line’s slope = −k). - Second order: plot 1/[A] vs. t → slope = +k. So you identify the order by which plot is linear (CED 5.3.A.1–3), fit a line, and take the magnitude (and sign) of its slope to get k (CED 5.3.A.4). For first-order reactions you can also use t1/2 = 0.693/k to check k (CED 5.3.A.5). For more worked examples and practice, see the Topic 5.3 study guide (https://library.fiveable.me/ap-chemistry/unit-5/concentration-changes-over-time/study-guide/Owtcz3zbxFZXsPI7YfwJ) and the AP practice problems (https://library.fiveable.me/practice/ap-chemistry).
How do you calculate half-life for first order reactions and why is it always the same?
For a first-order reaction the integrated rate law is ln[A]t = ln[A]0 − kt (CED 5.3.A.2). To get the half-life, set [A]t = 1/2 [A]0 and solve: ln(1/2 [A]0) = ln[A]0 − kt1/2 ln(1/2) = −kt1/2 t1/2 = −ln(1/2)/k = ln(2)/k ≈ 0.693/k Because ln(2) is just a constant and the initial concentration [A]0 cancels out, t1/2 depends only on k, not on [A]0—so every equal-k first-order reaction has the same half-life regardless of starting amount. That’s why radioactive decay (a common AP example) shows a constant half-life (CED 5.3.A.6). For more practice and a short Topic 5.3 review, see the concentration changes study guide (https://library.fiveable.me/ap-chemistry/unit-5/concentration-changes-over-time/study-guide/Owtcz3zbxFZXsPI7YfwJ) and the AP Chem practice set (https://library.fiveable.me/practice/ap-chemistry).
Can someone explain why radioactive decay is always first order kinetics?
Radioactive decay is always treated as first order because each nucleus has a constant probability per unit time to decay—that probability (k) doesn’t depend on how many other nuclei are around. That gives the differential rate law: rate = −d[N]/dt = k[N]. Integrating yields ln[N]t − ln[N]0 = −kt, so a plot of ln[N] vs. time is linear (CED 5.3.A.2). A key consequence is a constant half-life: t1/2 = 0.693/k (CED 5.3.A.5), which matches experimental decay data. This is why radioactive processes are the canonical example of first-order kinetics on the AP exam (CED 5.3.A.6). If you want a quick refresher on integrated rate laws and practice problems, see the Topic 5.3 study guide (https://library.fiveable.me/ap-chemistry/unit-5/concentration-changes-over-time/study-guide/Owtcz3zbxFZXsPI7YfwJ) and Fiveable’s AP Chemistry practice set (https://library.fiveable.me/practice/ap-chemistry).
What's the difference between a first order reaction and a second order reaction in terms of their graphs?
First-order vs second-order shows up in which transformed plot is linear. - First order: [A] vs t is an exponential decay (curved). A plot of ln[A] vs t is linear with slope = -k (integrated law: ln[A]t − ln[A]0 = -kt). Half-life is constant and t1/2 = 0.693/k (so repeated half-lives are equal)—useful on the AP (CED 5.3.A.2, 5.3.A.5). - Second order: [A] vs t also curves, but more steeply as [A] gets small. A plot of 1/[A] vs t is linear with slope = +k (integrated law: 1/[A]t − 1/[A]0 = kt) (CED 5.3.A.3). On the exam, identify order by which transformed plot (ln[A] or 1/[A]) gives a straight line and use its slope to find k (CED 5.3.A.4). For a quick review, see the Topic 5.3 study guide (https://library.fiveable.me/ap-chemistry/unit-5/concentration-changes-over-time/study-guide/Owtcz3zbxFZXsPI7YfwJ) and try practice problems (https://library.fiveable.me/practice/ap-chemistry).
How do I memorize all these integrated rate law equations for the AP exam?
Don’t try to rote-memorize every algebraic rearrangement—learn the three forms and how to recognize them from plots and slopes. Quick checklist to memorize and use on exam: - Zeroth order: [A] vs t is linear → [A]t − [A]0 = −kt (slope = −k). - First order: ln[A] vs t is linear → ln[A]t − ln[A]0 = −kt (slope = −k). Half-life constant: t1/2 = 0.693/k. - Second order: 1/[A] vs t is linear → 1/[A]t − 1/[A]0 = kt (slope = +k). Study strategy: practice reading which plot is linear, then write the matching integrated form and identify slope sign. Make a one-line cheat: “0 → [A], 1 → ln[A], 2 → 1/[A].” Do lots of quick graph/fit problems so recognition becomes automatic (AP cares about identifying order from plots and using slope to get k per CED 5.3.A.1–4). For focused review, see the Topic 5.3 study guide (https://library.fiveable.me/ap-chemistry/unit-5/concentration-changes-over-time/study-guide/Owtcz3zbxFZXsPI7YfwJ) and drill practice problems (https://library.fiveable.me/practice/ap-chemistry).
I missed the lab on concentration changes - how do you actually measure this stuff over time?
You measure concentration vs. time by repeatedly recording a property that changes as the reactant (or product) changes, then use integrated rate laws to get order and k. Common methods: - Spectrophotometry/colorimetry: measure absorbance at set times and convert to [A] with Beer's law—great for colored or UV-active species. - Titration samples: withdraw small aliquots at times, quench if needed, titrate to find [A]. - Conductivity or ion-selective electrodes: for ionic reactants/products. - Gas collection or pressure: measure product gas volume or pressure vs. time. - Initial-rate or pseudo-first-order: keep one reactant in large excess so one concentration is effectively constant. Plot your data per the CED: [A] vs. t (zeroth), ln[A] vs. t (first; linear; use t1/2 = 0.693/k), and 1/[A] vs. t (second). That determines order and k. For lab review and practice problems, see the Topic 5.3 study guide (https://library.fiveable.me/ap-chemistry/unit-5/concentration-changes-over-time/study-guide/Owtcz3zbxFZXsPI7YfwJ), Unit 5 overview (https://library.fiveable.me/ap-chemistry/unit-5), and lots of practice questions (https://library.fiveable.me/practice/ap-chemistry).
Why does the half-life equation only work for first order reactions?
Because the half-life formula t1/2 = 0.693/k comes directly from the first-order integrated rate law. For a first-order reaction the integrated law is ln[A]t − ln[A]0 = −kt, which rearranges to [A]t = [A]0 e^(−kt). Setting [A]t = 1/2[A]0 gives 1/2 = e^(−kt1/2) → t1/2 = ln2 / k (≈0.693/k). The key point: the fraction remaining (1/2) is independent of [A]0 because concentration decays exponentially for first order, so t1/2 is constant. For other orders the half-life depends on the initial concentration. Example: zeroth order t1/2 = [A]0/(2k) and second order t1/2 = 1/(k[A]0). Because those depend on [A]0, there’s no single constant half-life formula like the first-order one. This is exactly why AP CED emphasizes first-order ln[A] vs. time linearity and the constant half-life relation (see 5.3.A.2 and 5.3.A.5). For a quick review, check the Topic 5.3 study guide on Fiveable (https://library.fiveable.me/ap-chemistry/unit-5/concentration-changes-over-time/study-guide/Owtcz3zbxFZXsPI7YfwJ) and practice problems (https://library.fiveable.me/practice/ap-chemistry).
How do you know which type of plot to make when you're given concentration and time data?
Pick the plot that would give a straight line for the possible integrated rate law. Test three options and see which is linear: - Zeroth order: plot [A] vs t. If linear with slope = −k, reaction is zero order (use [A]t − [A]0 = −kt). - First order: plot ln[A] vs t. If linear with slope = −k, reaction is first order (ln[A]t − ln[A]0 = −kt). Also first-order half-life is constant: t1/2 = 0.693/k. - Second order: plot 1/[A] vs t. If linear with slope = +k, reaction is second order (1/[A]t − 1/[A]0 = kt). AP CED expects you to identify order from these integrated plots and use the slope to get k (5.3.A.1–5.3.A.4). Practically, transform your concentration data into all three plots and pick the one with the best straight line (highest R²). For extra practice, see the Topic 5.3 study guide (https://library.fiveable.me/ap-chemistry/unit-5/concentration-changes-over-time/study-guide/Owtcz3zbxFZXsPI7YfwJ) and more problems (https://library.fiveable.me/practice/ap-chemistry).
What happens to the concentration vs time graph if the reaction is zero order?
For a zero-order reaction the concentration vs. time plot is a straight line with a constant negative slope. The integrated rate law is [A]t − [A]0 = −kt, so [A]t = [A]0 − kt—a linear decrease in [A] over time with slope = −k. The reaction goes to zero at t = [A]0/k. Unlike first order, the half-life depends on the initial concentration (t1/2 = [A]0/(2k)), so it’s not constant. On the AP exam you should recognize a zero order from a linear [A] vs. t graph and use its slope to find k (CED 5.3.A.1 and 5.3.A.4). For a quick refresher check the Topic 5.3 study guide (https://library.fiveable.me/ap-chemistry/unit-5/concentration-changes-over-time/study-guide/Owtcz3zbxFZXsPI7YfwJ) and try practice problems (https://library.fiveable.me/practice/ap-chemistry).
I don't understand why ln[A] vs time is linear for first order - can someone explain this?
Start from the differential rate law for a first-order reaction: rate = −d[A]/dt = k[A]. Separate variables and integrate: d[A]/[A] = −k dt ∫ from [A]0 to [A]t (d[A]/[A]) = −∫0 to t k dt ln[A]t − ln[A]0 = −kt Rearrange: ln[A]t = −kt + ln[A]0. That’s the equation of a straight line (y = mx + b) with y = ln[A], x = t, slope m = −k, and intercept b = ln[A]0. So if the reaction is truly first order, plotting ln[A] vs. time gives a straight line whose slope equals −k. This is exactly why AP asks you to use ln[A] vs time to identify first order (CED 5.3.A.2) and to find k (CED 5.3.A.4). Also useful: first-order half-life is constant, t1/2 = 0.693/k (CED 5.3.A.5). For extra practice, check the Topic 5.3 study guide (https://library.fiveable.me/ap-chemistry/unit-5/concentration-changes-over-time/study-guide/Owtcz3zbxFZXsPI7YfwJ) and more problems (https://library.fiveable.me/practice/ap-chemistry).
How do you use the slope from these graphs to find the actual rate constant value?
Use the integrated-rate plots and the slope of the linear fit to read k directly: - Zeroth order: plot [A] vs t. Integrated form: [A]t − [A]0 = −kt. The slope of [A] vs t = −k, so k = −(slope). Units: M·s⁻¹ (or M·min⁻¹). - First order: plot ln[A] vs t. Integrated form: ln[A]t − ln[A]0 = −kt. The slope of ln[A] vs t = −k, so k = −(slope). Units: s⁻¹ (or min⁻¹). Useful AP fact: half-life t1/2 = 0.693/k for first order. - Second order: plot 1/[A] vs t. Integrated form: 1/[A]t − 1/[A]0 = kt. The slope of 1/[A] vs t = +k, so k = slope. Units: M⁻¹·s⁻¹. Make sure you fit a straight line (least-squares) and check which plot is linear to identify order first (CED 5.3.A.1–A.4). For practice and examples see the Topic 5.3 study guide (https://library.fiveable.me/ap-chemistry/unit-5/concentration-changes-over-time/study-guide/Owtcz3zbxFZXsPI7YfwJ) and more practice problems (https://library.fiveable.me/practice/ap-chemistry).