Phillips Curve
The Phillips curve is a graph that shows how inflation rates and unemployment rates are related to each other, both in the short-run and long-run. It is actually just a reflection of the AD/AS graph. In the short-run, there is a trade-off between inflation and unemployment.
This graph deals with the twin evils (inflation and unemployment) continue to trade off. Unfortunately, we don't live in a perfect world, so we can never have inflation low and unemployment low at the same. When both are high, it's called stagflation, and it happens when the economy is (literally) on the verge of collapsing.
In the short run, inflation and unemployment have an inverse relationship. However, in the long run, unemployment will stay at a natural rate (reflecting the vertical nature of the long run Philips curve). The economy is always operating somewhere along the short-run Phillips curve, while in the long run, unemployment stays at a natural rate. Therefore, the long-run equilibrium is the intersection of SRPC and LRPC.
The economy is always operating somewhere along the SRPC
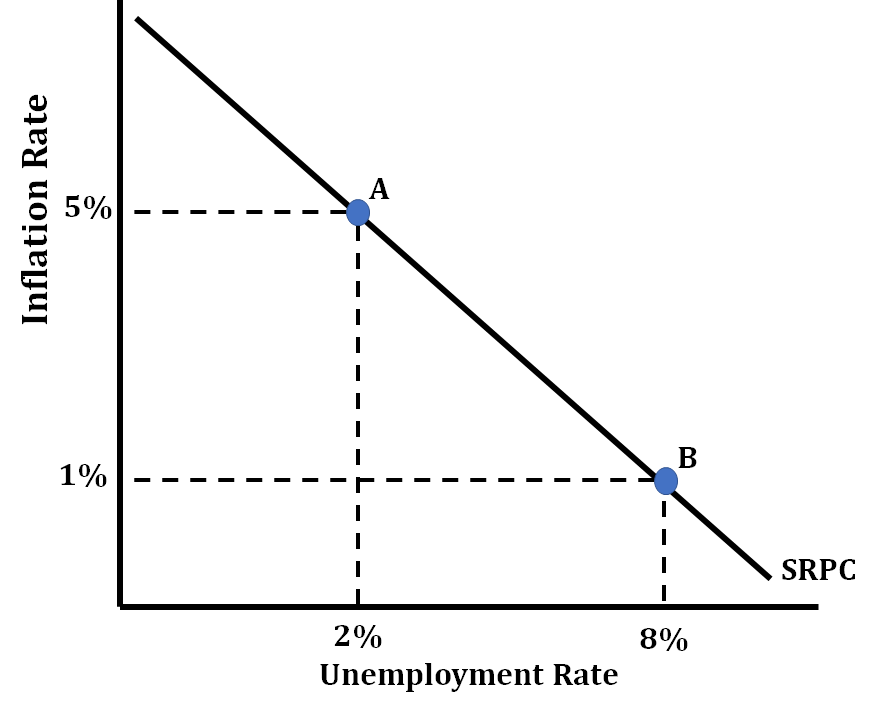
Inflation is low when unemployment is high because fewer people are working, and there is less demand for goods and services. As a result, prices don't rise as fast. When unemployment gets lower, inflation gets higher because so many more people have jobs and the money to spend on things. This means that there is a higher demand for goods and services, which increases prices.

Shifting AD
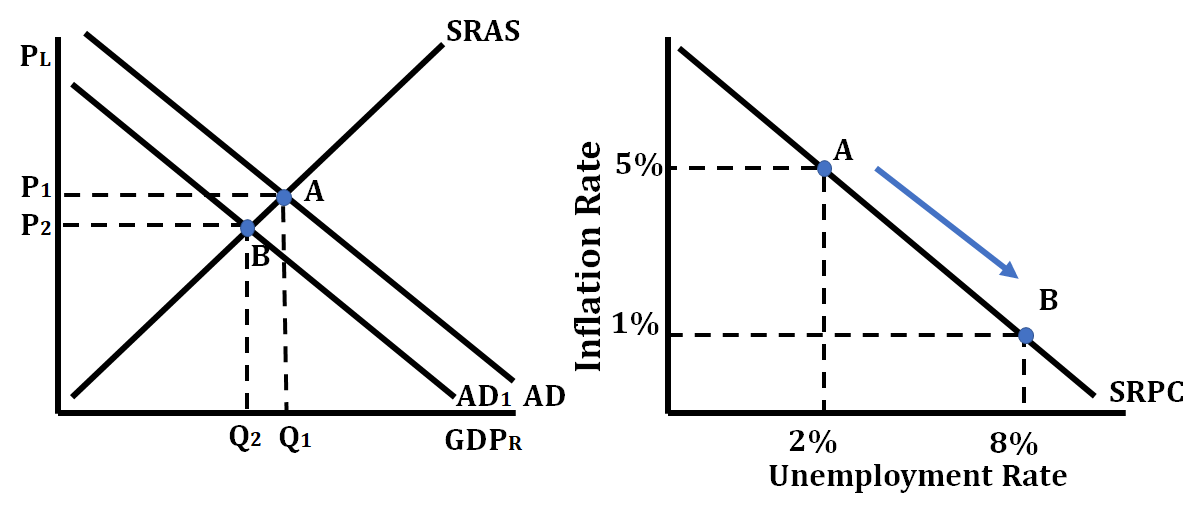
The AS/AD graph and the Phillips curve have a lot in common. In the AS/AD graph, a decrease in AD causes a change in equilibrium from point A to point B. The same change in AD that causes the price level (PL) to fall and the real GDP to fall causes inflation to fall but unemployment to rise. This is mirrored on the short-run Phillips curve with a movement from point A to point B. See graph below.
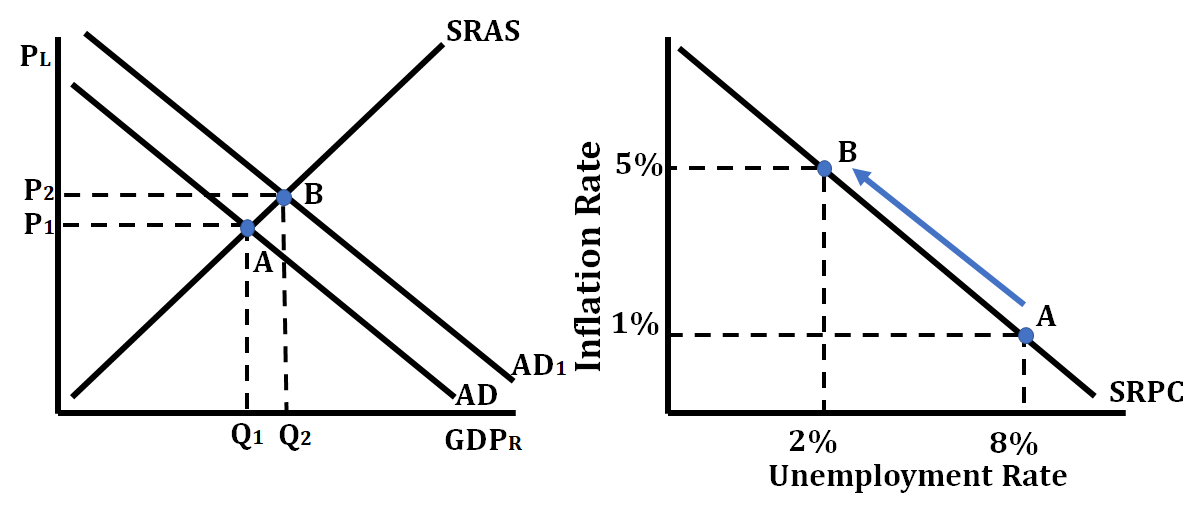
In the AS/AD graph, an increase in AD causes a change in equilibrium from point A to point B. The same change in AD that causes the price level (PL) to increase and the real GDP to increases causes inflation to rise but unemployment to fall. This is mirrored on the short-run Phillips curve with a movement from point A to point B.
Shifting SRAS
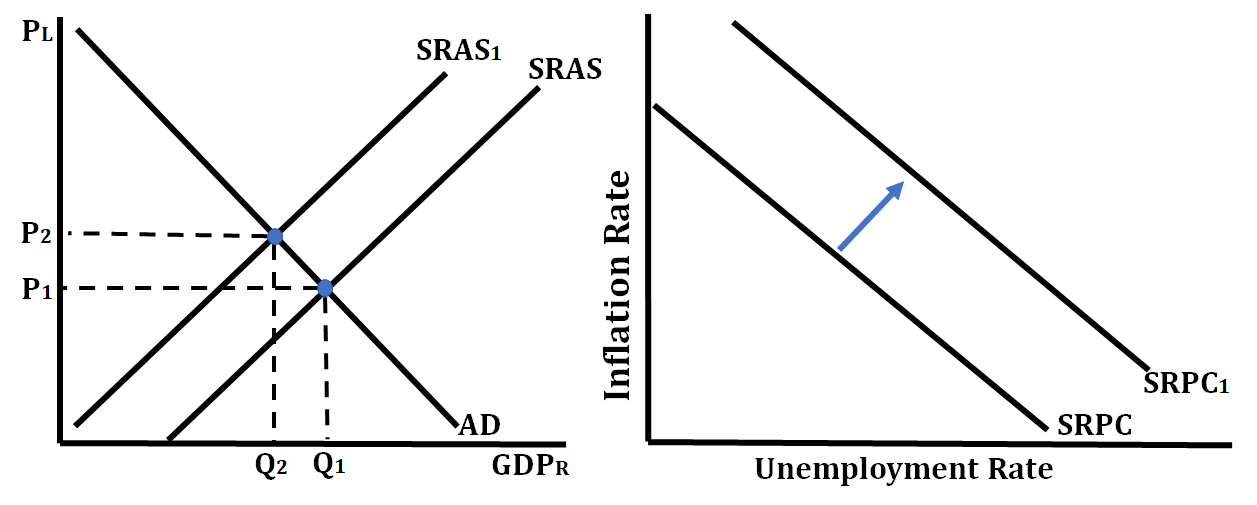
Whenever something makes the SRAS curve shift right or left, the short-run Phillips Curve (SRPC) shifts in the opposite direction. If the SRAS curve shifts right, the SRPC will shift left, causing price level (inflation) and unemployment to fall. However, if the SRAS curve shifts left, the SRPC will shift right, indicating stagflation because unemployment rate and inflation are both increasing.
In the case of the graph below, an increase in the SRAS curve, a shift to the right of this curve to SRAS1, will result in a leftward shift of the SRPC curve.
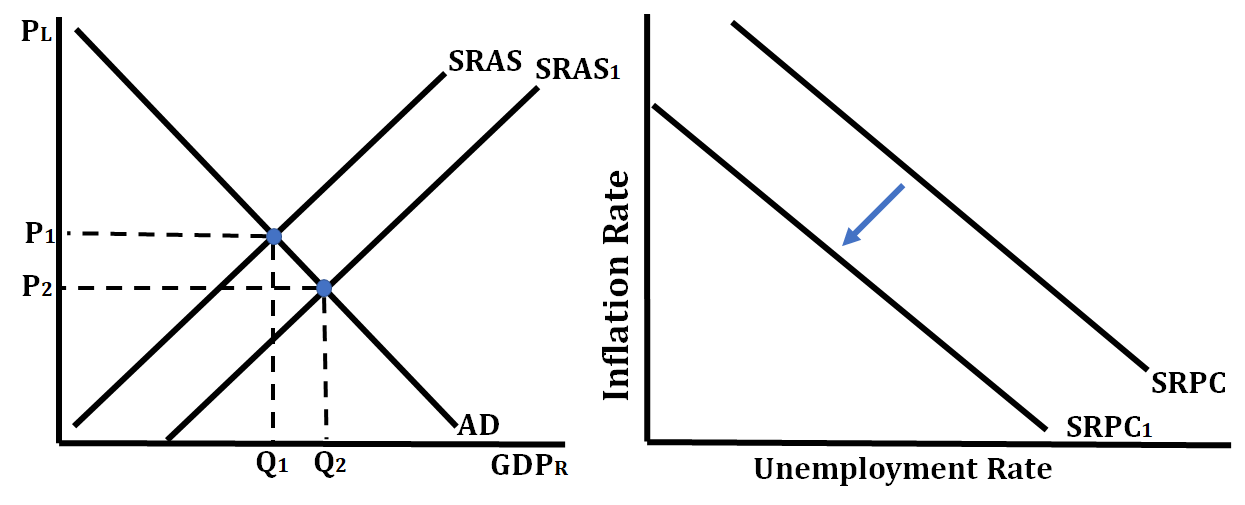
A decrease in the SRAS curve, a shift to the left of this curve, will result in a rightward shift of the SRPC curve.
Long-Run Philips Curve
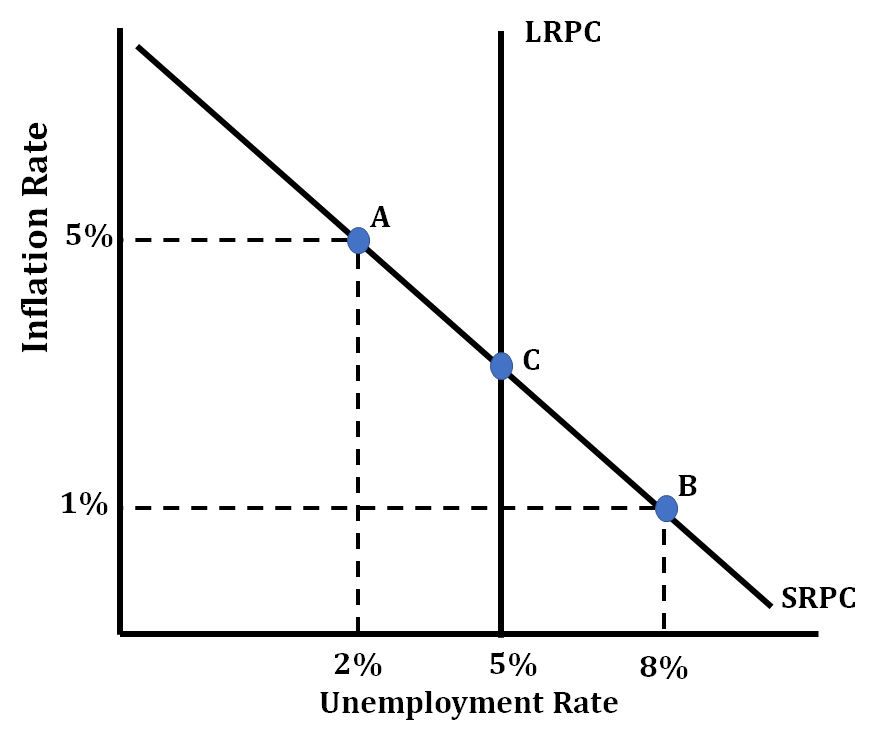
The long-run Phillips curve (LRPC) shows that, in the long-run, there is no trade-off between inflation and unemployment. The LRPC exists at an economy's natural rate of unemployment, which just so happens to correspond to full employment and the LRAS. The graph below shows an LRPC at the economy's natural rate of unemployment of 5%. When an economy's natural rate of unemployment changes, so does LRPC. The LRPC tells us that policies to change the level of employment in the economy will ultimately result in only changes in the inflation rate.
Vocabulary
The following words are mentioned explicitly in the College Board Course and Exam Description for this topic.
| Term | Definition |
|---|---|
| demand shocks | Unexpected changes in aggregate demand that cause movement along the short-run Phillips curve. |
| employment | The state of having a paid job or being engaged in work for compensation. |
| inflation | A sustained increase in the general price level of goods and services in an economy over time. |
| inflationary gap | An economic condition represented by points to the left of long-run equilibrium, where actual output exceeds potential output and inflation pressures exist. |
| long run | A time period in macroeconomics where all factors of production are variable and prices fully adjust to changes in supply and demand. |
| long-run equilibrium | The point where the short-run Phillips curve intersects the long-run Phillips curve, representing a stable economic state. |
| long-run Phillips curve | A vertical curve at the natural rate of unemployment that illustrates the long-run relationship between inflation and unemployment. |
| natural rate of unemployment | The unemployment rate that exists when the economy produces full-employment real output, equal to the sum of frictional and structural unemployment. |
| Phillips curve model | An economic model showing the relationship between the rate of inflation and the rate of unemployment in an economy. |
| recessionary gap | An economic condition represented by points to the right of long-run equilibrium, where actual output falls short of potential output and unemployment is elevated. |
| short run | A time period in macroeconomics where at least one factor of production is fixed and prices may not fully adjust to changes in demand. |
| short-run equilibrium | The point where aggregate demand and short-run aggregate supply intersect, determining the current price level and output in the Phillips curve model. |
| short-run Phillips curve | A downward-sloping curve that illustrates the short-run trade-off between inflation and unemployment in an economy. |
| supply shocks | Unexpected changes in aggregate supply that cause the short-run Phillips curve to shift. |
Frequently Asked Questions
What is the Phillips curve and why does it slope downward?
The Phillips curve shows the relationship between inflation and unemployment. The short-run Phillips curve (SRPC) slopes downward because, in the short run, higher inflation is associated with lower unemployment—think: when aggregate demand rises, prices (inflation) go up and firms hire more, cutting cyclical unemployment (EK MOD-3.A.1, EK MOD-3.A.2). With given inflation expectations, higher actual inflation reduces real wages temporarily, so firms expand output and employment. The long-run Phillips curve (LRPC) is vertical at the natural rate of unemployment (NAIRU); in the long run inflation doesn’t change the natural rate (EK MOD-3.A.3). Remember: demand shocks move you along the SRPC, while supply shocks shift the SRPC, and changes in the natural rate shift the LRPC (EK MOD-3.B.1–3). For AP practice, be ready to draw SRPC and LRPC and explain short-run vs long-run equilibrium (see the Topic 5.2 study guide (https://library.fiveable.me/ap-macroeconomics/unit-5/phillips-curve/study-guide/tO36uHUjJI2P365apgB4), unit overview (https://library.fiveable.me/ap-macroeconomics/unit-5) and extra practice questions (https://library.fiveable.me/practice/ap-macroeconomics)).
How do I know if I'm looking at a short-run or long-run Phillips curve on a graph?
Look for two visual cues: slope and position. - Short-run Phillips curve (SRPC) is downward sloping—higher inflation, lower unemployment (a short-run trade-off). If the curve on the graph slopes down, it’s the SRPC. Movements along it = demand shocks; shifts of it = supply shocks or changes in inflation expectations (EK MOD-3.A.1, EK MOD-3.B.1-2). - Long-run Phillips curve (LRPC) is vertical at the natural rate of unemployment (NAIRU). If the curve is vertical (no trade-off between inflation and unemployment), that’s the LRPC (EK MOD-3.A.3). Long-run equilibrium is where the SRPC crosses the LRPC (EK MOD-3.A.4). On FRQs you’ll be asked to draw both and show short-run vs long-run adjustments—practice drawing the downward SRPC and the vertical LRPC at the natural rate. For more review see the Topic 5.2 study guide (https://library.fiveable.me/ap-macroeconomics/unit-5/phillips-curve/study-guide/tO36uHUjJI2P365apgB4) and extra practice (https://library.fiveable.me/practice/ap-macroeconomics).
What's the difference between the SRPC and LRPC?
Short-run Phillips curve (SRPC): downward-sloping—it shows the short-run trade-off between inflation and unemployment. In the short run the economy sits somewhere on the SRPC (higher AD → higher inflation and lower unemployment, and vice-versa). Demand shocks move you along the SRPC; supply shocks shift it. Inflation expectations and wage/price adjustments matter in the short run. Long-run Phillips curve (LRPC): vertical at the natural rate of unemployment (NAIRU). In the long run there’s no trade-off between inflation and unemployment—inflation can change but unemployment returns to the natural rate. Long-run equilibrium is where the SRPC crosses the LRPC. Factors that change the natural rate (like labor market policies or productivity) shift the LRPC. On the AP exam you may need to draw and label both curves and show movements/shifts (Skill 4). For a focused review, see the Topic 5.2 study guide (https://library.fiveable.me/ap-macroeconomics/unit-5/phillips-curve/study-guide/tO36uHUjJI2P365apgB4), the Unit 5 overview (https://library.fiveable.me/ap-macroeconomics/unit-5), and practice problems (https://library.fiveable.me/practice/ap-macroeconomics).
I don't understand why the long-run Phillips curve is vertical - can someone explain?
Think of the long-run Phillips curve (LRPC) as saying: in the long run, unemployment goes back to its natural rate no matter what the inflation rate is. In the short run the SRPC slopes downward because unexpected inflation can temporarily lower unemployment (firms hire more when real wages fall). But over time workers and firms adjust their inflation expectations and nominal wages rise, so real wages return to levels that give the natural rate of unemployment. That’s why the LRPC is vertical at the natural rate (EK MOD-3.A.3) —there’s no long-run trade-off between inflation and unemployment. Long-run equilibrium is just where the SRPC crosses that vertical LRPC (EK MOD-3.A.4). For exam prep, be ready to explain this with a graph and to show how demand shocks move you along the SRPC while supply/expectation changes shift it (EK MOD-3.B.1–B.2). For a clear study guide and practice problems, see Fiveable’s Topic 5.2 Phillips Curve guide (https://library.fiveable.me/ap-macroeconomics/unit-5/phillips-curve/study-guide/tO36uHUjJI2P365apgB4) and the Unit 5 overview (https://library.fiveable.me/ap-macroeconomics/unit-5).
What does it mean when the economy is at the natural rate of unemployment?
Being at the natural rate of unemployment means the economy has only frictional and structural unemployment—no cyclical unemployment. On the Phillips curve model that means the economy sits at the vertical long-run Phillips curve (LRPC) at the natural rate (also called NAIRU). Short run: you can move along the SRPC (a trade-off between inflation and unemployment). Long run: the SRPC and LRPC intersect at the natural rate (long-run equilibrium), so changes in inflation don’t permanently change unemployment. Points left of that intersection are inflationary gaps; points right are recessionary gaps. Policy implication for the AP exam: expansionary policy can lower unemployment only temporarily (it raises inflation in the long run), while only structural changes (training, labor-market reforms) can shift the natural rate (see CED EK MOD-3.A.3–A.5 and EK MOD-3.B.3). For a quick refresher, check the Topic 5.2 study guide (https://library.fiveable.me/ap-macroeconomics/unit-5/phillips-curve/study-guide/tO36uHUjJI2P365apgB4) and more unit resources (https://library.fiveable.me/ap-macroeconomics/unit-5). Practice problems are at (https://library.fiveable.me/practice/ap-macroeconomics).
How do I tell if a point on the Phillips curve represents an inflationary gap or recessionary gap?
Look at where the point sits relative to the long-run Phillips curve (LRPC)—that tells you the gap. - If the point is left of the long-run equilibrium (unemployment < natural rate), it’s an inflationary gap. Output is above potential and upward pressure on inflation exists. (CED EK MOD-3.A.5) - If the point is right of the long-run equilibrium (unemployment > natural rate), it’s a recessionary gap. Output is below potential and inflationary pressure is weak. Equivalently: compare actual unemployment to the natural (NAIRU). Actual < natural = inflationary gap; actual > natural = recessionary gap. On the SRPC this is a point left or right of where the SRPC meets the vertical LRPC (long-run equilibrium). Remember demand shocks move you along the SRPC; supply shocks shift the SRPC (CED EK MOD-3.B.1–B.2). For a refresher and practice, see the Topic 5.2 study guide (https://library.fiveable.me/ap-macroeconomics/unit-5/phillips-curve/study-guide/tO36uHUjJI2P365apgB4) and more practice problems (https://library.fiveable.me/practice/ap-macroeconomics).
What happens to unemployment and inflation when there's a demand shock vs a supply shock?
Short answer: they act differently. - Demand shock (AD change)—movement along the SRPC (EK MOD-3.B.1). An expansionary demand shock raises inflation and lowers unemployment in the short run (you move up/left along the downward-sloping SRPC). A contractionary demand shock lowers inflation and raises unemployment (move down/right). In the long run, unemployment returns to the natural rate (LRPC is vertical at the natural rate, EK MOD-3.A.3); demand shocks don’t change the natural rate. - Supply shock (AS change)—shifts the SRPC (EK MOD-3.B.2). A negative supply shock (e.g., oil price spike) raises inflation and raises unemployment simultaneously (stagflation)—SRPC shifts up/right. A positive supply shock lowers inflation and unemployment—SRPC shifts down/left. If the supply shock changes the natural rate (labor market effects), the LRPC can shift too (EK MOD-3.B.3). For more AP-aligned explanation and graphs, see the Topic 5.2 study guide (https://library.fiveable.me/ap-macroeconomics/unit-5/phillips-curve/study-guide/tO36uHUjJI2P365apgB4). Practice AP-style questions are at (https://library.fiveable.me/practice/ap-macroeconomics).
When does the Phillips curve shift and when do we just move along it?
Short answer: you move along the short-run Phillips curve (SRPC) when something changes aggregate demand—that’s a demand shock. If AD rises, inflation goes up and unemployment falls (movement down the SRPC); if AD falls, inflation falls and unemployment rises (movement up the SRPC). The SRPC itself shifts when supply-side factors or inflation expectations change—e.g., an oil shock or higher expected inflation shifts the SRPC up/left (higher inflation at every unemployment rate) or down/right. The long-run Phillips curve (LRPC) is vertical at the natural rate of unemployment; it shifts only when the natural rate changes (labor-market policies, demographics, or structural changes). Remember CED EKs: EK MOD-3.A.1–3 and EK MOD-3.B.1–3. For a clear review and examples, see the Topic 5.2 study guide (https://library.fiveable.me/ap-macroeconomics/unit-5/phillips-curve/study-guide/tO36uHUjJI2P365apgB4) and try practice questions (https://library.fiveable.me/practice/ap-macroeconomics).
Why do supply shocks shift the short-run Phillips curve but demand shocks don't?
Short answer: demand shocks move you along the short-run Phillips curve (SRPC) because they change aggregate demand, which changes unemployment and inflation together but don’t change the relationship between them. A positive demand shock (higher AD) lowers unemployment and raises inflation—that’s a movement up along the downward-sloping SRPC. Supply shocks shift the SRPC because they change firms’ costs or expected inflation, altering the trade-off itself. A negative supply shock (e.g., oil price spike) raises inflation and raises unemployment at the same time (stagflation), so the whole SRPC shifts up/right. In expectations-augmented Phillips-curve terms, supply shocks change inflation expectations or real wage costs, so the SRPC moves; demand shocks just change the economy’s point on the existing SRPC. This distinction is exactly what the CED emphasizes (EK MOD-3.B.1 and EK MOD-3.B.2). For a quick review, see the Topic 5.2 study guide (https://library.fiveable.me/ap-macroeconomics/unit-5/phillips-curve/study-guide/tO36uHUjJI2P365apgB4) and practice questions (https://library.fiveable.me/practice/ap-macroeconomics).
What causes the natural rate of unemployment to change and how does that affect the graphs?
The natural rate of unemployment changes when the structural or frictional features of the labor market change—not because of short-run demand. Examples: better job matching (faster job search), more training/education, lower unemployment benefits, reduced union power, or tech that creates more jobs all lower the natural rate; worse matching, higher structural mismatch, or policies that raise reservation wages raise it. On AP graphs: the LRPC is vertical at the natural rate, so when the natural rate falls the LRPC shifts left (e.g., from 6% to 5%); when it rises the LRPC shifts right. Remember: the SRPC is downward sloping—an economy moves along the SRPC for demand shocks (EK MOD-3.A.1 & EK MOD-3.B.1), while supply shocks shift the SRPC (EK MOD-3.B.2). Long-run equilibrium is where the SRPC crosses the (shifted) LRPC (EK MOD-3.A.4). For a quick AP-aligned review, see the Phillips Curve study guide (https://library.fiveable.me/ap-macroeconomics/unit-5/phillips-curve/study-guide/tO36uHUjJI2P365apgB4). For more practice, check the Unit 5 overview (https://library.fiveable.me/ap-macroeconomics/unit-5) and 1000+ practice questions (https://library.fiveable.me/practice/ap-macroeconomics).
How do I draw what happens to the Phillips curve during a recession?
Draw a downward-sloping short-run Phillips curve (SRPC) and a vertical long-run Phillips curve (LRPC) at the natural rate of unemployment. During a recession you move rightward along the SRPC: unemployment rises above the natural rate and inflation falls (a point to the right of the LRPC = recessionary gap). On an AP free-response you should label: SRPC, LRPC (vertical at NAIRU), the initial point, and the recession point (higher unemployment, lower inflation). Remember CED EK MOD-3.A.1–A.5 and EK MOD-3.B.1: a demand shock (recession) causes movement along the SRPC. If lower inflation expectations persist, the SRPC can shift downward over time so the economy returns to the LRPC at the natural rate (lower inflation but unemployment back to natural rate). Practice drawing this for full-credit FRQs—see the Topic 5.2 study guide (https://library.fiveable.me/ap-macroeconomics/unit-5/phillips-curve/study-guide/tO36uHUjJI2P365apgB4) and more practice problems (https://library.fiveable.me/practice/ap-macroeconomics).
I'm confused about long-run equilibrium - where exactly is it on the Phillips curve model?
Long-run equilibrium on the Phillips Curve is the point where the short-run Phillips curve (SRPC) crosses the long-run Phillips curve (LRPC). The LRPC is vertical at the natural rate (NAIRU), so long-run equilibrium has unemployment = the natural rate and inflation = expected inflation. Remember: the economy is always somewhere on the SRPC in the short run, but only at the SRPC–LRPC intersection is it in long-run equilibrium. Points left of that intersection are inflationary gaps (unemployment < natural rate); points right are recessionary gaps (unemployment > natural rate). On the AP exam you may be asked to draw and label this intersection (see EK MOD-3.A.4). For a refresher and practice drawing the SRPC/LRPC and shocks that move or shift them, check the Phillips Curve study guide (https://library.fiveable.me/ap-macroeconomics/unit-5/phillips-curve/study-guide/tO36uHUjJI2P365apgB4), the Unit 5 overview (https://library.fiveable.me/ap-macroeconomics/unit-5), and extra practice problems (https://library.fiveable.me/practice/ap-macroeconomics).
What's the relationship between the Phillips curve and stagflation?
The Phillips curve shows a short-run trade-off: the SRPC slopes downward so lower unemployment tends to come with higher inflation (and vice versa) (EK MOD-3.A.1–A.2). Stagflation happens when a negative supply shock (like an oil price spike) shifts the SRPC up/right (EK MOD-3.B.2). That shift raises inflation and raises unemployment at the same time—so you get high inflation + high unemployment. In the long run there’s no trade-off: the LRPC is vertical at the natural rate of unemployment (EK MOD-3.A.3), so attempts to keep unemployment below the natural rate just raise inflation expectations (Friedman/Phelps, expectations-augmented Phillips curve). For AP prep, make sure you can draw the SRPC shifting from a supply shock and explain short-run vs. long-run outcomes (see the Topic 5.2 study guide) (https://library.fiveable.me/ap-macroeconomics/unit-5/phillips-curve/study-guide/tO36uHUjJI2P365apgB4). For extra practice, check Unit 5 resources and AP problems (https://library.fiveable.me/ap-macroeconomics/unit-5) and the practice bank (https://library.fiveable.me/practice/ap-macroeconomics).
How does the Phillips curve connect to monetary and fiscal policy effects?
The Phillips curve links policy to trade-offs between inflation and unemployment. Expansionary fiscal or monetary policy raises AD → in the short run you move down along the SRPC: unemployment falls and inflation rises (a short-run trade-off, EK MOD-3.A.1 and EK MOD-3.B.1). Contractionary policy does the opposite (move up the SRPC). In the long run expectations adjust (expectations-augmented Phillips curve): higher inflation expectations shift the SRPC right, returning unemployment to the natural rate (LRPC is vertical at the natural rate, EK MOD-3.A.3), so policy can’t permanently lower unemployment—only temporarily change inflation. Supply shocks instead shift the SRPC (EK MOD-3.B.2), causing stagflation. On the AP exam you should show these effects with correctly labeled SRPC/LRPC graphs and explain short-run movements vs. long-run shifts (CED graphing requirements). For a focused review, see the Topic 5.2 Phillips curve study guide (https://library.fiveable.me/ap-macroeconomics/unit-5/phillips-curve/study-guide/tO36uHUjJI2P365apgB4), the Unit 5 overview (https://library.fiveable.me/ap-macroeconomics/unit-5), and practice problems (https://library.fiveable.me/practice/ap-macroeconomics).
Can the Phillips curve help explain what happened during the 2008 financial crisis?
Yes—the Phillips curve helps explain 2008 mostly as a demand shock. The financial crisis caused aggregate demand to collapse, so the economy moved along the short-run Phillips curve (SRPC) toward higher unemployment and lower inflation (or disinflation). Because this was a demand-driven recessionary gap, the long-run Phillips curve (LRPC)—vertical at the natural rate of unemployment—didn’t shift. Expectations-augmented theory predicts that in the long run inflation returns to expected rates and unemployment moves back toward the natural rate (EK MOD-3.A.1, .3; EK MOD-3.B.1). Policy (fiscal and monetary) aimed to shift AD right to reduce the output gap; you can show this on SRPC/LRPC graphs on the AP free-response (Skill 4 tasks). For a quick review of how demand vs. supply shocks affect the SRPC and LRPC, see the Topic 5.2 study guide (https://library.fiveable.me/ap-macroeconomics/unit-5/phillips-curve/study-guide/tO36uHUjJI2P365apgB4). For more practice, check the Unit 5 overview (https://library.fiveable.me/ap-macroeconomics/unit-5) and the 1000+ practice questions (https://library.fiveable.me/practice/ap-macroeconomics).