SAT Math: Guide to Statistics & Data Analysis
tl;dr: The SAT Math section consists of two sections, one that allows the use of a calculator and one that does not. On each section, you'll need to be able to work with tables, graphs, and equations to answer multiple-choice and grid-in questions. You should also be familiar with statistics and data analysis topics such as probability, mean, median, mode, etc. We've provided a few sample practice problems to help you get started.
Overview of the SAT Math Section
The Math section of the SAT will be the third and fourth sections and will look like the following:
- 25 minute section that is completed without the use of a calculator (of any kind, no exception), followed by
- 55 minute section that allows the use of a graphing calculator, even though the technology is not always necessary. 🖩
- Each section of the Math portion of the SAT begins with multiple-choice questions, each question having four choices.
- Following the multiple choice questions will be questions that do not have choices. Instead, students will bubble in their answers; these questions are often called "grid-in" questions.
- The reference sheet will be available for ALL Math sections of the SAT, regardless of whether calculators are allowed on that section or not.
Breakdown of the Math Sections for the SAT:
- On the calculator portion, some of the grid-in questions will be related to each other as part of an “Extended Thinking” question.
Topics pertaining to “Statistics & Data Analysis”:
- Table data
- Scatterplots
- Data inferences
- Center, spread, and shape of distributions
- Data collection and conclusions
What You Need to Know for the "Statistics & Data Analysis" Section
- Use tables to summarize data, such as probabilities.
- Estimate populations based on sample data.
- Use statistics to determine mean, median, mode, range, and/or standard deviation.
- Evaluate tables, graphs, or text summaries.
- Determine the accuracy of a data collection method.
Sample SAT Stats Math Problems 📚
Non-calculator practice problems:
General directions for this section that should be expected:
- The use of a calculator is not allowed at all in this section.
- All variables and expressions represent real numbers unless otherwise specified.
- Figures are drawn to scale unless otherwise specified.
- Assume that all figures lie in a plane.
- Assume that the domain of a given function is the set of all real numbers unless otherwise specified.
- The following example is considered “easy” in difficulty:
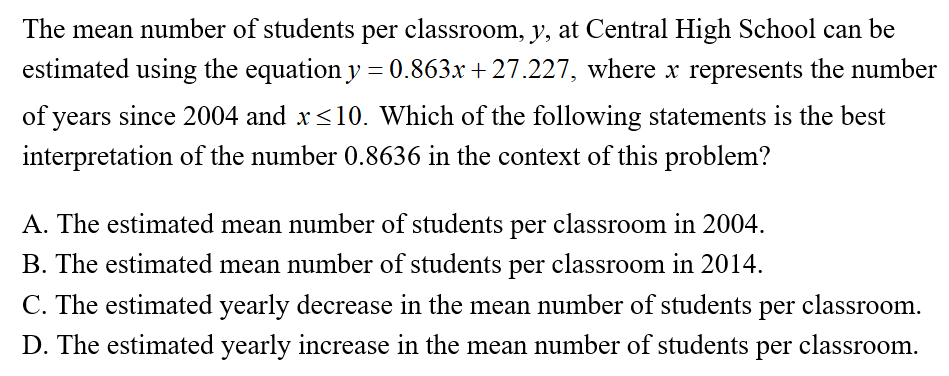
The correct answer is D.
Recall that a linear function has the form y = m*x + b, where m represents the slope or rate of increase/decrease of the given function. In the given equation, this will be the value 0.863, which represents the amount that the average (or mean) number of students per classroom changes per year. Since the value 0.863 is positive, this will be a rate of increase.
Calculator section practice problems:
General directions for this section you should expect to see:
- A graphing calculator is allowed for this section, although not often necessary. (use the calculator as a tool, not as a crutch!)
- All variables and expressions represent real numbers unless otherwise specified.
- Given pictures or figures are drawn to scale unless otherwise specified.
- Assume that all figures lie in a plane.
- Assume that the domain of a given function is the set of all real numbers unless otherwise specified.
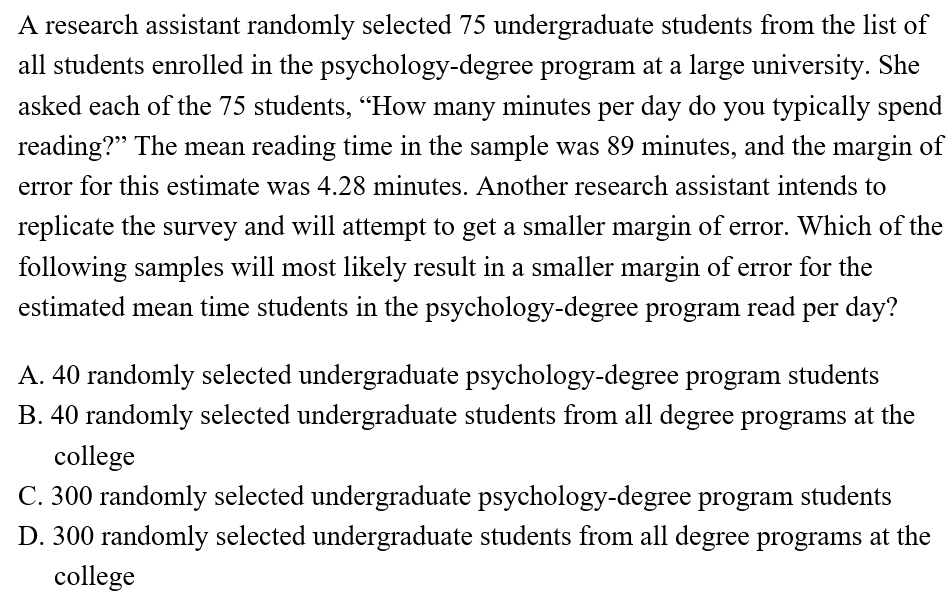
- The following question is considered “easy” in difficulty. Read and understand the survey, understand the statistics, and then understand the relationship between sample size and margin of error.
2. The following sample question is considered easy. Read and understand a two-way table and then use categorical variables to figure out the result.
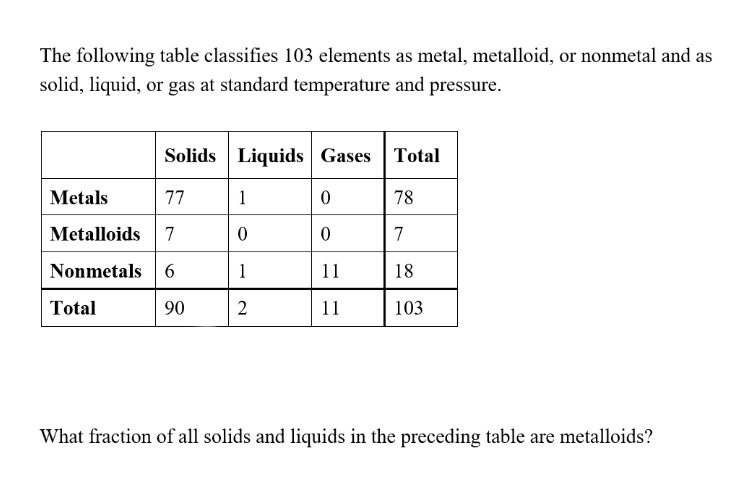
The correct answer is 7/92.
The table contains seven metalloids that are solids, zero that are liquid, and 90 + 2 = 92 total for solids and liquids combined. Therefore, the resulting probability (fraction) will be 7 over 92, or 7/92. 3. The following example is considered to be “easy” level of difficulty. Read and understand the given information, as presented in the given table. Determine which information is useful, and to use this information to compare.
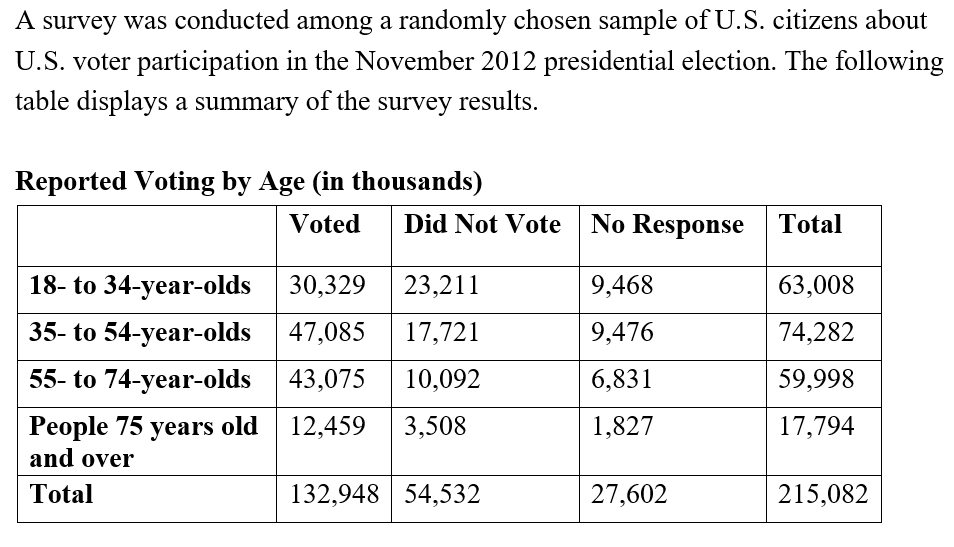
The correct answer is C.
Using the given information from the table, look for the values that are closest to each other in the “voted” column and the “total” column, which is found in the 55 to 74-year-old data, since this ratio will be the highest at about 71.8%
4. This example is considered “medium.” difficulty. Look at values from a random sample and extrapolate to estimate a population parameter.
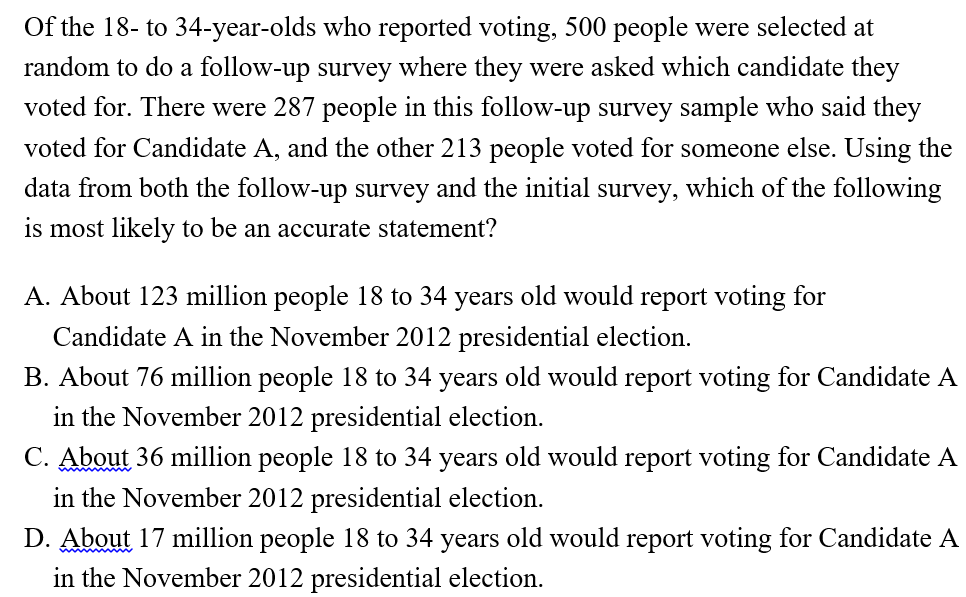
The correct answer is D.
Looking to determine how many of the 18 to 34-year-olds voted for Candidate A, which can be found by finding the ratio of people who voted for Candidate A and multiplying this by the total amount of people who are between 18 and 34. The fraction 287/500 will be multiplied by 30,329,000, which will give almost 17 million, which is closest to choice D.
5. This problem is considered “medium” difficulty. Use the information to determine whether the results can be generalized to the study population as well as whether a cause‑and‑effect relationship exists between the results.
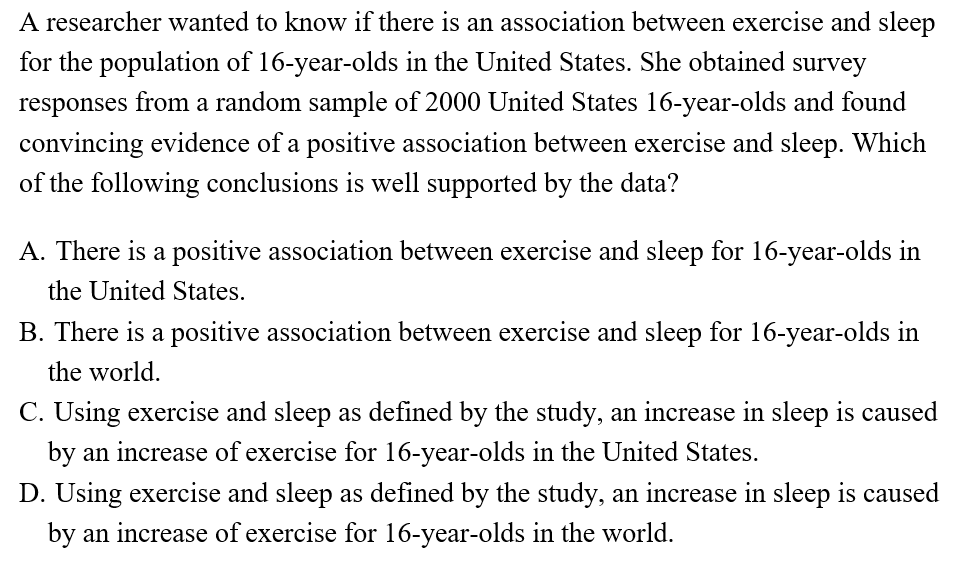
The correct answer is A.
A relationship in the data can only help generalize for the population from which the information was drawn.
6. The final calculator question for this section is considered a “medium” level of difficulty. Use the graph to determine what information is important.
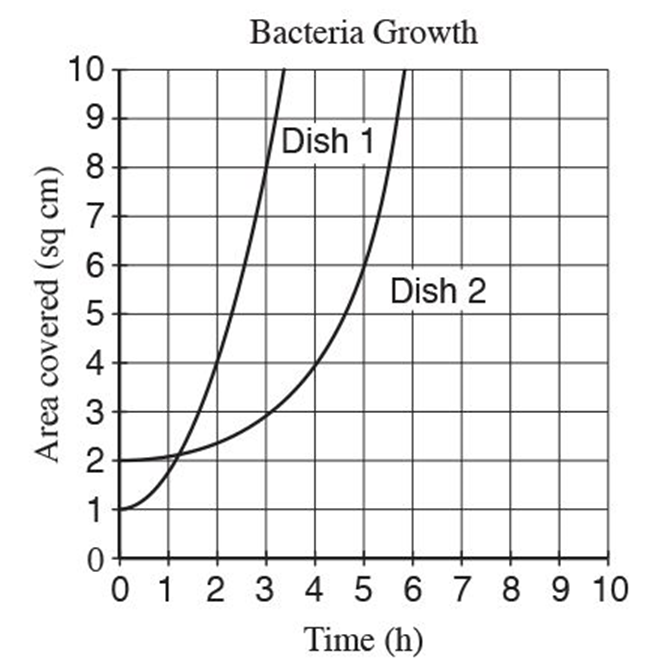

The correct answer is B.
Each petri dish has an area of 10 cm^2. At time=0, Dish 1 is 10% covered and Dish 2 is 20% covered, so choice B is correct.
Closing 🌟
Congratulations! You’ve made it to the end of “SAT Math - Statistics and Data Analysis” prep 🙌 You should have a better understanding of the Math sections for the SAT© , topic highlights, what you will have to be able to do in order to succeed, as well as have seen some practice questions that put the concepts in action. Good luck studying for the SAT Math section 👏
Need more resources? Check out our complete SAT Math Study Guide w/ Practice Problems. Pressed on time? Watch the Night Before the SAT cram session. You got this 🥳.
.png)


