Electrical and Electromagnetic Logging Principles
Electrical and electromagnetic logging methods measure the resistivity and conductivity of subsurface formations to determine lithology, fluid content, and saturation. These measurements are central to identifying hydrocarbon-bearing zones and estimating how much oil, gas, or water fills the pore space. Because hydrocarbons are far more resistive than formation water, resistivity logs give you one of the most direct indicators of pay zones.
Two broad approaches exist. Electrical logging applies a current directly to the formation and measures potential differences. Electromagnetic logging induces eddy currents in the formation and measures the resulting electromagnetic response. Both approaches are shaped by the same formation properties, but each has strengths in different borehole and formation conditions.
Fundamental Concepts and Measurement Techniques
Formation resistivity depends on several factors working together:
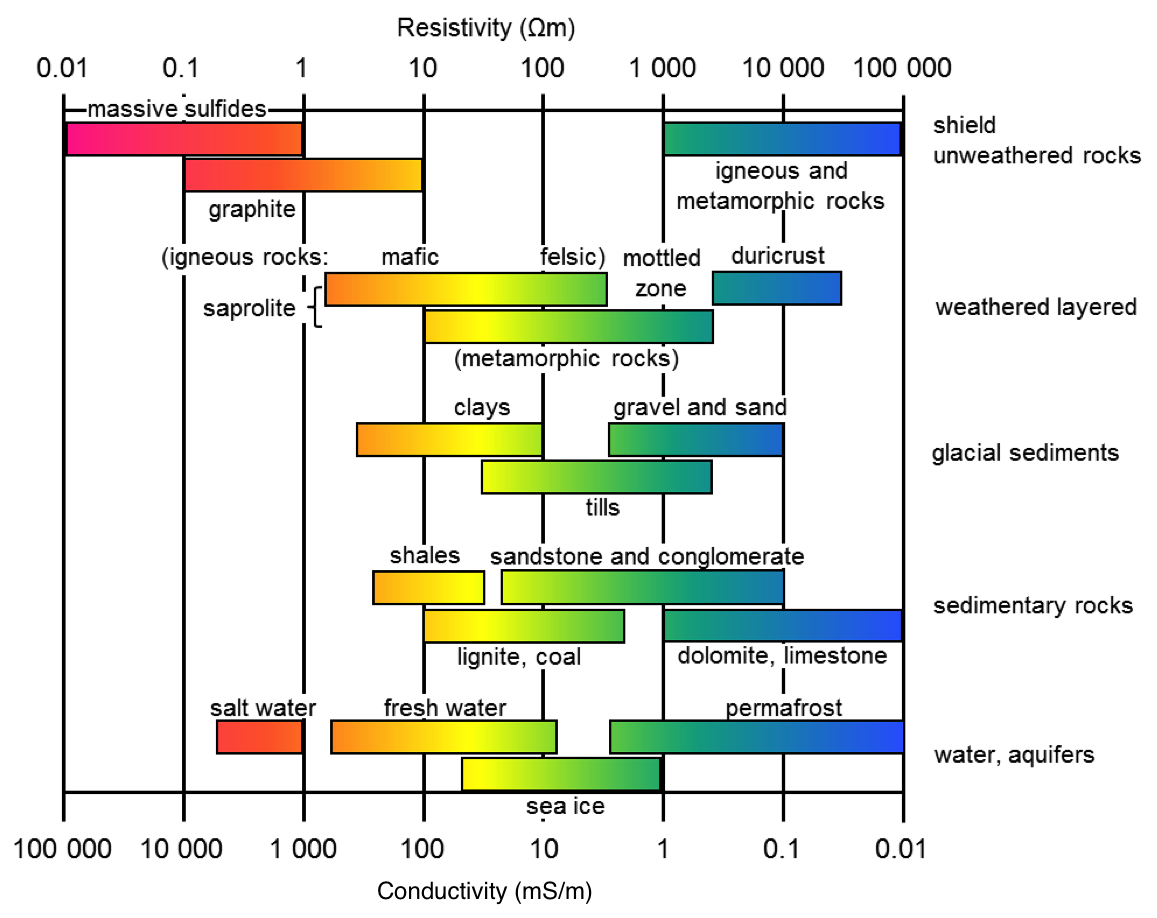
- Lithology — sandstones, shales, and carbonates each have characteristic baseline resistivities
- Porosity — more pore space means more room for conductive fluids, generally lowering resistivity
- Fluid type — water (especially saline water) conducts electricity well; oil and gas do not
- Saturation — the fraction of pore space filled by each fluid directly controls the bulk resistivity
The depth of investigation (how far into the formation the tool "sees") and vertical resolution (the thinnest bed the tool can distinguish) both depend on electrode or coil spacing, signal frequency, and formation resistivity. Wider spacing and lower frequencies probe deeper but resolve less detail. Tighter spacing and higher frequencies give sharper vertical resolution but read shallower.
Factors Influencing Formation Resistivity and Conductivity
The dominant control on formation resistivity is the type and volume of fluid in the pores. Saline formation water is highly conductive, so water-saturated rocks have low resistivity. Hydrocarbons replace conductive water with a resistive fluid, driving resistivity up.
Archie's Law quantifies this relationship for clean (clay-free), consolidated formations:
where:
- = true formation resistivity
- = resistivity of formation water
- = porosity
- = water saturation (fraction of pore space filled with water)
- = tortuosity factor (often ~1)
- = cementation exponent (typically 1.8–2.0 for sandstones)
- = saturation exponent (typically ~2)
Rearranging for is the most common use: if you know from the log, from water samples or SP logs, and from porosity logs, you can solve for water saturation. Whatever pore space isn't water is assumed to be hydrocarbons.
Beyond fluids, mineralogy matters. Conductive minerals like clays and pyrite lower the measured resistivity, which can mask hydrocarbons and cause you to overestimate . Non-conductive matrix minerals (quartz, calcite) have the opposite effect. Temperature also plays a role: hotter formation water conducts better, so resistivity decreases with depth as temperature rises.
Logging Methods and Applications
Conventional and Focused Resistivity Logs
Normal and lateral logs are the oldest electrical logging tools. They use different electrode arrangements and spacings to sample different depths into the formation:
- Normal logs (e.g., 16-inch short normal, 64-inch long normal) place the current and potential electrodes on the same tool. The spacing between them sets the depth of investigation. The 16-inch reads the invaded zone; the 64-inch reads deeper.
- Lateral logs place the current electrode above the potential electrodes, producing a more focused measurement with better vertical resolution.
Micro-resistivity logs read very close to the borehole wall. Tools like the micro-spherically focused log (MSFL) and micro-cylindrically focused log (MCFL) have tiny electrode spacings that resolve thin beds (down to a few inches) and characterize the flushed zone created by mud filtrate invasion.
Laterologs (e.g., dual laterolog, array laterolog) use guard electrodes to force current into the formation in a focused beam. This minimizes the influence of the borehole fluid and invasion zone. Laterologs work best in low-resistivity formations drilled with water-based muds, where unfocused tools would be overwhelmed by the conductive borehole environment.
Induction and Dielectric Logging Techniques
Induction logs work on a completely different principle. A transmitter coil generates an alternating magnetic field that induces eddy currents in the formation. A receiver coil then measures the secondary electromagnetic field produced by those eddy currents, which is proportional to formation conductivity.
Induction tools are the go-to choice when:
- Formation resistivity is high (roughly >50 ohm-m)
- The well is drilled with oil-based or non-conductive mud (where laterologs can't establish a current path through the borehole fluid)
Higher transmitter frequencies and shorter coil spacings improve vertical resolution but reduce the depth of investigation.
Dielectric logs measure the dielectric permittivity of the formation rather than its resistivity. Water has a dielectric constant of about 80, while most hydrocarbons fall between 2 and 5, and rock matrix is around 4–8. This large contrast makes dielectric logs especially useful in situations where resistivity alone is ambiguous, such as low-resistivity pay zones, freshwater formations, or complex lithologies where Archie's Law breaks down.
Resistivity and Conductivity Logs for Fluid Analysis
Identification of Potential Pay Zones
A hydrocarbon-bearing zone shows up as a resistivity increase relative to surrounding water-wet formations. But resistivity alone doesn't tell you everything. Combining resistivity with other log types sharpens the interpretation:
- High resistivity + low neutron porosity + low bulk density → likely gas (gas has very low hydrogen index and low density)
- High resistivity + moderate neutron porosity + moderate density → likely oil
- Low resistivity throughout → likely water-bearing (or shaly formation requiring further analysis)
This multi-log approach is standard practice because no single measurement uniquely identifies fluid type.
Estimation of Fluid Saturation and Hydrocarbon Type
Once you've identified a potential pay zone, the next step is estimating using Archie's Law. The hydrocarbon saturation is then .
Invasion profiles provide additional diagnostic information. When drilling fluid invades the formation, it displaces some of the original pore fluid near the borehole. Comparing shallow-reading and deep-reading resistivity tools reveals a characteristic profile:
- Step profile (shallow resistivity < deep resistivity): Typical of a water-bearing zone where conductive mud filtrate has invaded, making the near-borehole zone even more conductive than the uninvaded formation.
- Ramp profile (shallow resistivity > deep resistivity): Typical of a hydrocarbon-bearing zone where mud filtrate (often more resistive than formation water) has displaced some hydrocarbons near the borehole, raising the shallow resistivity above the deep reading.
Recognizing these patterns helps confirm whether a resistivity anomaly reflects true formation fluids or just invasion effects. Dielectric logs can further resolve ambiguity, since the large dielectric contrast between water and hydrocarbons persists regardless of salinity.
Induction and Laterolog Techniques for Resistivity Evaluation
Selection of Appropriate Logging Techniques
Choosing between induction and laterolog tools comes down to three main factors:
- Expected formation resistivity — Induction tools perform best in resistive formations (>50 ohm-m). Laterologs perform best in conductive formations (<50 ohm-m).
- Drilling mud type — Induction tools work in oil-based or air-drilled holes where there's no conductive path through the borehole fluid. Laterologs require a conductive (water-based) mud to establish a current circuit.
- Desired resolution and depth of investigation — Array tools in both families offer multiple spacings, giving you both shallow and deep readings simultaneously.
In practice, many logging programs run both tool types (or array versions that span a wide resistivity range) to get the most complete picture.
Environmental Corrections and Interpretation Challenges
Raw log readings must be corrected for environmental effects before you can extract true formation resistivity:
- Borehole size — Larger boreholes expose more mud to the tool, pulling the apparent resistivity toward the mud resistivity. Caliper data is used to apply the correction.
- Mud resistivity — Conductive muds decrease apparent resistivity readings. The mud resistivity (measured at surface and corrected to downhole temperature) is a required input.
- Temperature — Formation fluid resistivity drops as temperature increases. You need a reliable temperature profile to correct both the mud and formation water resistivity values.
Service companies provide correction charts (or software equivalents) for each tool. Skipping these corrections can introduce significant error, especially in large or rugose boreholes.
Common interpretation challenges include:
- Thin beds — Beds thinner than the tool's vertical resolution get averaged with surrounding layers, suppressing resistivity peaks and making pay zones look less promising than they are. High-resolution tools or deconvolution techniques help.
- Conductive minerals — Clays and pyrite conduct electricity through pathways that have nothing to do with pore fluids. Archie's Law assumes all conductivity comes from pore water, so shaly formations require modified equations (e.g., Waxman-Smits or dual-water models) to avoid overestimating .
- Complex lithologies — Carbonates, fractured formations, and vuggy porosity systems don't follow the simple pore geometry Archie's Law assumes. These require integration of image logs, core data, and specialized interpretation workflows.