📊AP Statistics Review
AP Stats Mixed Units Practice FRQ #1 & Feedback
📊AP Statistics
Review
AP Stats Mixed Units Practice FRQ #1 & Feedback
Practicing FRQs is a great way to prep for the AP exam! Review student responses for an FRQ prompt and corresponding feedback from Fiveable Teacher Jerry Kosoff.
The Practice FRQ Prompt
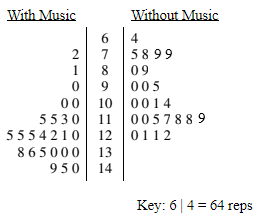
A common activity in physical education classes is the running “beep test,” where students must run a certain distance across a gym, then wait for a beep to run back. This process continues back-and-forth across the gym until the student fails to reach the other side before the beep and must stop. Each time the student successfully beats the beep is called a “rep.” A student in a large high school recruited 50 other students to participate in an experiment to determine if playing motivational music during the beep test would improve performance. The students were randomly assigned to two groups: one group completed the beep test with motivational music playing in the background; the other group completed the beep test without anything being played. The groups completed the test at separate times without seeing the other group compete. The back-to-back stem plot below summarizes the results of the beep test for the two groups.
One student who participated in the experiment will be selected at random.
- (a) What is the probability that the selected student completed fewer than 100 reps? (b) What is the probability that the selected student completed fewer than 100 reps, given that they ran without music?
- Write a few sentences comparing the distribution of reps completed for the two treatments.
- An appropriate statistical test concluded that there was a statistically significant difference between the treatments. Explain what “statistically significant” means in this context.
- In the context of this scenario, explain why randomly assigning the participants to their groups was important.
Student Responses and Feedback

Student Sample 1
- a. The probability that a student completed fewer than 100 reps is 13/50.b. The probability that a student completed fewer than 100 reps given that they ran without music is 10/25.
- The shape of the distribution of reps completed by students with music appears to be skewed left while the shape of the distribution of the reps completed by students without music appears to be bimodal. The range of reps completed with music is larger than the range of reps completed without music. The mean number of reps completed by students with music is larger than the mean number of reps completed by students without music.
- Since this is a proper experiment and a random allocation of treatments was distributed, we can conclude that there was a statistically significant difference between the treatments. This occurs because we can conclude according to the datas observations that there is a difference between the number of reps completed with music and without music.
- Randomly assigning the participants to their groups was important to make sure that you have the opportunity to have different populations attended including those that usually work out with motivational music and those who do not work out to motivational music. In addition, by randomly assigning the groups, there’s an opportunity to get different skill levels on agility and an opportunity to get rid of distractions from friends.
Teacher feedback
Both #1 and #2 will receive full credit. In #2, you do a good job of comparing the distributions instead of just describing. Your description of “bimodal” for the “without music” side is a bit weak (I’d go with “skewed left”), but given the stemplot it would likely be accepted.
In #3, your description is lacking - while this is a “proper experiment,” that doesn’t explain what “statistically significant” actually means. This is a bit of an obscure definition, but “statistically significant” is what we mean when we have a “low p-value”… so that means that the observed differences between the treatment groups are unlikely to have occurred by chance (which means that we would reject a null hypothesis that the treatment groups would have no difference). So in this case, we would need to say something like “statistically significant in this context means that the difference in the mean number of reps completed by the two groups is unlikely to have happened by random chance; we can therefore conclude that the treatment caused the difference” (or something in that ballpark)
In #4, you get partly there - your description of getting “rid of distractions” or “different skill levels” is an in-context description of reducing possible confounding variables through randomization, but your description does not explicitly connect this to the response variable in question: the number of reps completed. Any answer about a “why” in an experiment/observational study should come back to the response variable. A way to strengthen your response could be saying something like “there’s an opportunity to get different skill levels on agility and reduce distractions from friends, which will allow us to compare the number of reps completed by each group more easily and fairly.”
Student Sample 2
- a) the probability that the selected student completed fewer than 100 reps is (13/50) = 0.26.b) the probability that the selected student completed fewer than 100 reps, given that they ran without music is (10/25) = 0.4.
- The distribution for running with music is skewed to the left while the distribution for without music is also skewed to the left. The range is larger for the distribution for with music than without and the center is larger for with music than for without.
- Statistically significant means that the probability of the difference between the two distributions being so extreme, was so low (low p value) that it would not have been possible for it to happen by chance. and therefore we can conclude that it was the treatments that caused this to happen
- Random assignment is important because it gives us an unbiased set of data from. a population and it makes it possible for us to make inferences about the population. If we did not randomly assign, it wouldn’t be able to draw inferences and it may be possible that the students choose which group based on their personal preference.
Teacher feedback
Overall, you’ve given strong responses. Your answers in the final three parts will need to have a little more context from the problem involved. On to the feedback:
For the probability calculations, you have gotten the correct values with appropriate work shown.
When comparing the distributions, you provide appropriate comparisons of shape, center, and spread. However, while you compare the group “with music” vs “without music,” you never mention what was being measured about the groups that you are comparing. In this case, it is the number of repetitions (reps) completed. Be sure to mention the variable in your answer; for example, “the range of number of reps completed is larger for the distribution with music than without”
While discussion “statistical significance,” you give a correct definition - the results are unlikely to have occurred by chance alone - but you do not describe what the results are in this case. That is, you should say “the difference in the mean number of reps completed by the two groups is so low that it would not have been unlikely (not impossible, as you say) to occur by chance.” Similarly, when discussing random assignment, you should give a possible reason for why students choosing their group would potentially introduce confounding to this experiment. (Perhaps they will try harder when competing against their friends, regardless of the music playing). All of your responses would likely earn partial credit, but to get full credit, you must include the context of the problem in your answers.
Student Sample 3
- a) 0.26b) 0.4
- The “with music” graph appears to be skewed to the left and unimodal, while the “without music” graph is also skewed left, but bimodal. The median of the “with music” graph is around 122-124 reps, while the median of the “without music” graph is between 100-101 reps. The “with music” graph has a larger range in comparison. Neither of the graphs appear to carry any outliers.
- Since this was a randomized experiment, we are allowed to draw a conclusion. This means there is a difference in the mean number of reps performed by students listening to music vs. students not listening to any music, and it can’t be attributed to chance.
- If the students were not randomly assigned treatments they may have chosen their preferred method of running, whether it’s with or without music. This might have made the results less reliable because they would choose what they’re naturally comfortable with, potentially increasing their number of reps.
Teacher feedback
Nice work! All answers are correct, but some little things may prevent you from getting full credit.
In part 1 - you have to show where the 0.26 and 0.4 came from. Those are considered “naked answers” and must have the accompanying fractions shown to illustrate your work.
Then in part 2 - you list both medians, but don’t compare them with a comparison term. Yup, you have to spell it out for us readers… we’re not allowed to assume that you know 122 is larger that 101, as ridiculous as that sounds!