Fiveable
📊AP Statistics
​

📊AP Statistics

FRQ 6 – Investigative Task
​
Unit 1: Exploring One-Variable Data
​
AP Stats FRQ Types & Units

Each FRQ type tests specific skills taught in particular units. Here's why certain units appear for each question type:

FRQFocusUnitsWhy
FRQ 1Exploring Data1, 2Tests describing/analyzing data (distributions, scatterplots, correlation)
FRQ 2Sampling & Experimental Design3 onlyTests designing studies, identifying bias, randomization - all Unit 3 content
FRQ 3Probability & Sampling Distributions4, 5Tests probability calculations, expected value, sampling distributions
FRQ 4Inference6, 7, 8, 9Tests hypothesis tests and confidence intervals - each unit covers a different inference type
FRQ 5Multi-FocusAllCombines multiple skills across units in one integrated question
FRQ 6Investigative TaskAllOpen-ended investigation that can draw from any content

This mapping reflects College Board's exam structure - each FRQ type tests specific skills that are taught in particular units.

Practice FRQ 1 of 151/15

6. Mr. Alvarez is an agricultural researcher investigating the weight characteristics of two different heirloom tomato varieties, 'Crimson Giant' and 'Golden Sun', grown under identical conditions. Consistency in size is important for packaging and pricing. Mr. Alvarez harvested a random sample of 50 tomatoes of each variety and recorded their weights in grams. He wants to compare the symmetry of the weight distributions for the two varieties.

Bowley's Coefficient of Skewness

BQ=(Q3−Median)−(Median−Q1)Q3−Q1B_Q = \frac{(Q_3 - \text{Median}) - (\text{Median} - Q_1)}{Q_3 - Q_1}BQ​=Q3​−Q1​(Q3​−Median)−(Median−Q1​)​

A measure of skewness based on quartiles rather than the mean. It evaluates the symmetry of the middle 50% of the data. Values range from -1 to 1.

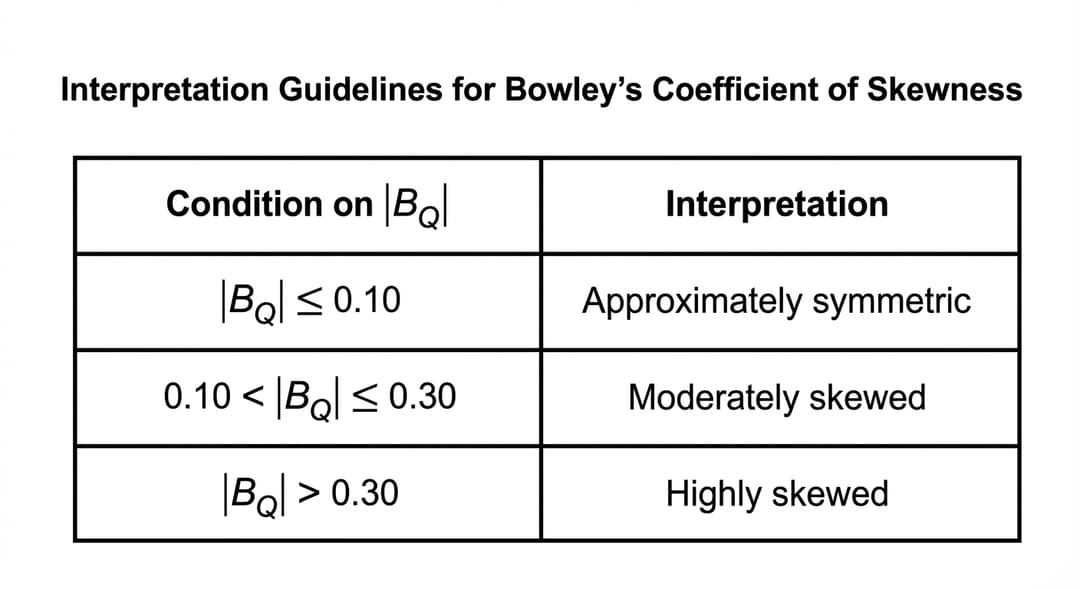
Interpretation Guidelines (Table 2):
• |B_Q| ≤ 0.10: Approximately symmetric
• 0.10 < |B_Q| ≤ 0.30: Moderately skewed
• |B_Q| > 0.30: Highly skewed
• Positive values indicate right skew; negative values indicate left skew.

Variety

n

Min

Q1

Median

Q3

Max

Crimson Giant

50

112

134

148

172

205

Golden Sun

50

115

152

176

188

198

Table 1. Five-Number Summaries of Tomato Weights

Single table only (no graph), centered on a blank white page.

Caption placement:
- Place caption text "Five-Number Summaries of Tomato Weights (grams)" centered above the table at page coordinate (500, 80). Caption font: bold, 18 pt.

Table geometry (use an exact rectangular grid):
- Outer border: rectangle with top-left corner at (120, 120) and bottom-right corner at (880, 320). Border thickness 2 pt, solid black.
- Table has EXACTLY 7 columns and EXACTLY 3 rows (1 header row + 2 data rows).
- Row boundaries (y-coordinates): header row top y=120, header bottom y=180; first data row bottom y=250; second data row bottom y=320.
  - Horizontal lines at y=120 (top border), y=180, y=250, y=320 (bottom border).
- Column boundaries (x-coordinates): x=120, 280, 360, 440, 560, 680, 780, 880.
  - This creates 7 columns with widths: 160, 80, 80, 120, 120, 100, 100.
  - Vertical lines at x=120 (left border), 280, 360, 440, 560, 680, 780, 880 (right border).

Cell text alignment and styling:
- All text centered within each cell (both horizontally and vertically).
- Header row font: bold 14 pt.
- Data rows font: regular 14 pt.
- No shading anywhere; white cell backgrounds.

Column headers (visible text in header row, row 1):
- Column 1 header (cell spanning x=120..280): "Variety"
- Column 2 header (x=280..360): "n"
- Column 3 header (x=360..440): "Min (g)"
- Column 4 header (x=440..560): "Q1 (g)"
- Column 5 header (x=560..680): "Median (g)"
- Column 6 header (x=680..780): "Q3 (g)"
- Column 7 header (x=780..880): "Max (g)"

Data values (EVERY cell explicitly listed, exactly as shown):
- Row 1 (header row): Variety | n | Min (g) | Q1 (g) | Median (g) | Q3 (g) | Max (g)
- Row 2 (Crimson Giant): Crimson Giant | 50 | 112 | 134 | 148 | 172 | 205
- Row 3 (Golden Sun): Golden Sun | 50 | 115 | 152 | 176 | 188 | 198

Do NOT include any additional notes about corrections (235) inside this figure; this figure must display the original maximum 205 for Crimson Giant exactly as listed above, because it is the given five-number summary used for Parts A–C.

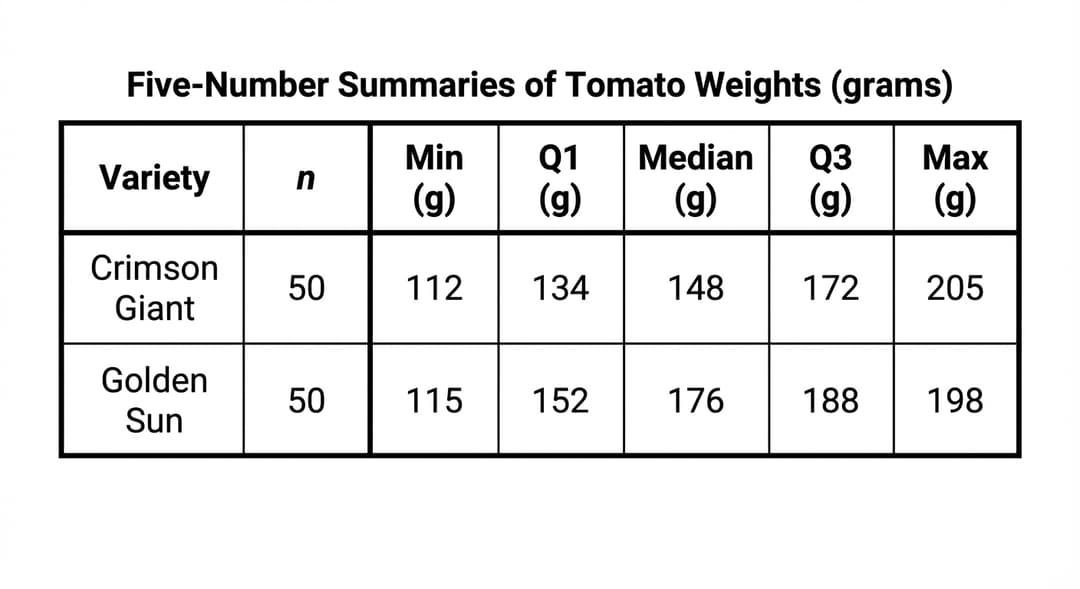
Table 2. Guidelines for Bowley’s Coefficient of Skewness

Single table only (no graph), centered on a blank white page.

Caption placement:
- Place caption text "Interpretation Guidelines for Bowley’s Coefficient of Skewness" centered above the table at page coordinate (500, 80). Caption font: bold, 18 pt.

Table geometry (exact rectangular grid):
- Outer border: rectangle with top-left corner at (140, 120) and bottom-right corner at (860, 340). Border thickness 2 pt, solid black.
- Table has EXACTLY 2 columns and EXACTLY 4 rows (1 header row + 3 data rows).
- Row boundaries (y-coordinates): y=120 (top border), y=175 (header bottom), y=230 (row 1 bottom), y=285 (row 2 bottom), y=340 (bottom border).
- Column boundaries (x-coordinates): x=140 (left border), x=460 (middle divider), x=860 (right border).
  - Column 1 width = 320; Column 2 width = 400.

Cell text alignment and styling:
- All text centered within each cell horizontally; vertically centered.
- Header row font: bold 14 pt.
- Data rows font: regular 14 pt.
- No shading; white backgrounds.

Column headers (visible text in header row):
- Column 1 header (x=140..460): "Condition on |B_Q|"
- Column 2 header (x=460..860): "Interpretation"

Data values (EVERY cell explicitly listed, exactly as shown; use the absolute value bars and inequality symbols):
- Row 1 (header row): Condition on |B_Q| | Interpretation
- Row 2: |B_Q| ≤ 0.10 | Approximately symmetric
- Row 3: 0.10 < |B_Q| ≤ 0.30 | Moderately skewed
- Row 4: |B_Q| > 0.30 | Highly skewed

Typography rules for mathematical symbols:
- The subscript Q in B_Q must appear as a true subscript (smaller and lowered). The absolute value bars must be vertical bars, not parentheses.
- Inequalities must be exactly: ≤, <, > (not spelled out).

Do NOT include any additional explanatory sentences outside the table; only the caption and the table.
A.

Calculate Bowley's Coefficient of Skewness for the Crimson Giant variety. Show your work.

B.

Calculate Bowley's Coefficient of Skewness for the Golden Sun variety. Using the interpretation guidelines provided, compare the skewness of the two tomato varieties.

C.

Explain why Bowley's Coefficient of Skewness might be a preferred measure over a skewness coefficient based on the mean (such as Pearson's coefficient) when the data set contains outliers.

D.

Suppose Mr. Alvarez discovers a data entry error in the Crimson Giant sample. The maximum value listed as 205 grams was actually 235 grams. Assume no other values change and the order of the data points remains the same.

i. Would the value of the sample mean for Crimson Giant increase, decrease, or stay the same? Explain your answer.

ii. Would the value of Bowley's Coefficient of Skewness for Crimson Giant calculated in Part A increase, decrease, or stay the same? Justify your answer based on the formula.


Pep

essential ap study content awaits..

Features
Testimonials
Testimonials
start studying →
FRQ Directions
Free Response Question Practice

This practice environment simulates the AP AP Statistics Free Response Questions section. Here are some guidelines:

  • Read each question carefullybefore responding. Pay attention to command verbs like "identify," "explain," "analyze," or "evaluate."
  • Use the timer to practice time management. You can pause, restart, or hide the timer as needed.
  • Mark for Review if you want to come back to a question later.
  • Your responses are saved automatically as you type. You can also use the drawing tool for questions that require diagrams or graphs.
  • Use the toolbar for formatting options like bold, italic, subscript, and superscript.
  • Navigate between questions using the Previous and Next buttons at the bottom of the screen.

Tip: Answer all parts of each question. Partial credit is often available, so even if you are unsure, provide what you know.